

Image source: CVS Health.
While we Fools are not big believers in technical analysis as the sole means of choosing a stock, we certainly recognize that charts can serve a useful purpose in helping to make better investment decisions. After all, charts can be quite helpful in zooming out to keep an eye on the big picture, and then can be instrumental in helping investors to see long-term trends that might not otherwise be clear from just reading press releases.
With that in mind, let's see how using a few charts can help to explain CVS Health's (CVS 1.49%) recent history. The five diagrams below go a long way toward explaining what retail pharmacy and pharmacy benefit manager has accomplished over the last few years, and they may even offer some insights as to where it's heading in the future.
1. Growth has been strong...

CVS Revenue (TTM) data by YCharts.
With more than $166 billion in trailing-12-month revenue, CVS Health is truly a healthcare force to be reckoned with. It's quite hard for companies of this size to continuously grow revenue at double-digit rates, but the company continues to prove that it's capable of doing just that.
What's driving the strong results? It's a combination of continued fast growth in both its retail empire and its pharmacy benefit management business, plus a handful of successful bolt-on acquisitions.
CVS Health's retail footprint took a sizable step forward thanks to last year's $1.9 billion acquisition of Target's pharmacy and clinical business. The deal single-handedly expanded the company's retail presence by more than 20% and provides the company with yet another way to conveniently reach customers.
Acquisitions have also helped to power the pharmacy benefits management business. Last year CVS Health paid $12.7 to buy out Omnicare, a leading provider of pharmacy services to long-term care facilities. The deal gave CVS Health a strong presence in a market that is poised for signifiant growth, especially with 10,000 baby boomers reaching retirement age every single day.
2. ...but margins have been weak
You may have noticed in the chart above that net income hasn't moved in the same continuous upward trajectory as revenue over the last few years. That's because the company's margin profile have heading the wrong direction for quite some time, and the problem only continues to get worse.

CVS Gross Profit Margin (TTM) data by YCharts.
Thankfully, management is aware of the issue and believes that the margin problem is temporary. The company stated that one-time costs related to the Target and Omnicare acquisitions are inflating its expense profile right now, but those costs will ease of time. In addition, both businesses have slightly different margin profiles than the company did prior to the acquisitions, and CVS Health believes that they should tick up once they are fully integrated.
3. Bringing down the share count
Even with the lower-margin profile, CVS Health continues to produces billions in free cash flow each year, and management has committed to using that excess cash to repurchase copious amounts of shares on the open market. For several years in a row, the company has shelled out billion on share repurchases, which has helped to slowly chip away at the number of shares outstanding.

CVS Average Diluted Shares Outstanding (Quarterly) data by YCharts.
More recently we've seen the company get quite aggressive with its repurchase activity, taking advantage of its share-price weakness in the first half of the year. So far in 2016, management has bought back more than $4 billion worth of stock, exhausting its planned buyback activity for the year.
4. Putting money in shareholders' pockets
Share repurchases are the primary way that the company rewards its shareholders, but CVS Health has a long history of paying out a strong dividend, too. Since initiating its first payout in 1985, the company has made a regular habit of bumping its payout.
More recently, we've seen a huge increase in its dividend growth rate. Last year the company announced a 21% increase in its dividend payment, which continues its recent history of making significant bumps to its quarterly payout.

CVS Dividend data by YCharts.
Better yet, last quarter the company boasted an adjusted payout ratio of 31%, which is still below its 2018 target of 35%. That hints that investors can expect to see more dividend increases in the years ahead.
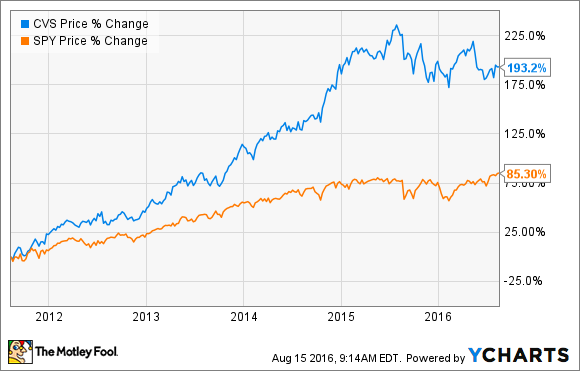
5. A winning formula
With revenue and profits moving in the right direction and the share count coming down, perhaps it shouldn't be a surprise to see that CVS Health investors have been rewarded with market-beating performance over the past five years.
Looking ahead, management is calling for full-year top-line growth of at least 17%, and for adjusted earnings per share to land between $5.81 to $5.89. That represents a solid growth rate of 12.5%, and analysts currently believe that the company will be able to pull off double-digit profit in each of the next five years. With shares trading hands for 16.7 times the midpoint of management's full-year earnings guidance range, and a dividend yield of 1.74%, I'd argue that this is a great time to consider adding a few shares of this long-term winner to your portfolio.


