
Procter & Gamble (PG 0.61%), the conglomerate that owns some of the world's most recognizable consumer products brands, such as Charmin, Tide, and Pampers, has a undergone some major changes in the past few years. Even though this company has faced stagnating sales in recent quarters, its historical dividend yield, decision to split off many of its non-performing brands to focus on long-term profitability, and relative market strength make this company look like a solid long-term play.
Because it's such a large, established business, investors shouldn't expect massive gains in revenue or earnings in the short term, but here are a few charts to show the impressive long-term history of this company.

Image source: Procter & Gamble.
Sales fall but could be set for long-term growth
P&G's sales appear to be in decline, going from over $80 billion in 2013 to just $65 billion in the most recent year. However, this drop in sales is not just because P&G is losing ground in the products it sells; it's because P&G has sold off more than half of its brands. In 2014, P&G implemented a new strategy to drive growth by divesting those sub-brands that weren't helping the company grow earnings. As a result, around 100 brands have been sold off in the past two years, with 65 core brands now making up all of P&G's sales and earnings.

PG Revenue (Annual) data by YCharts
Sales for fiscal 2016, which ended June 30, dropped from to $65 billion from $70 billion a year ago, but the proceeds of those brand sales led to a net income boost of 50% year over year. P&G management has said it plans for another $10 billion in cost cuts over the next five years as it focuses more on the highest-performing segments, which should help drive even more earnings growth in years to come.
P&G's expanding dividend
P&G's dividend has remained a strong part of this company's overall investment appeal, and its historical moves in steadily increasing its payout should give investors confidence. P&G has raised its payout consistently in each of the past 60 years. The company's most recent boost in April moved its dividend to $2.68 annually, which makes for a 3.1% yield at the current share price.

PG Dividend data by YCharts
Stock price history
Even though sales have fallen amid the company's turnaround strategy and the company's organic growth has been pressured by the strong dollar, its stock price has risen steadily. As seen in the following chart, even during times of broad market sell-offs, such as in 2000 or the recession of 2008, P&G has remained a pretty consistent stock, since many of P&G's products are non-cyclical, such as diapers and soap.
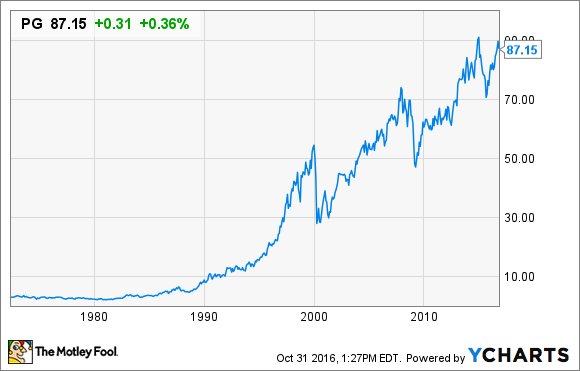
That chart takes into account P&G's various stock splits in its long history. The company has done a 2-for-1 split five times since going public, most recently in 2004, and it's possible that it could do so again soon.
P&G has been around for more than 100 years, and its history of rewarding shareholders who stick with the company over the long term shows no signs of stopping. There's very little chance that P&G will ever be a high-growth company again, or one that's very sexy in the products it offers or the headlines it makes. For investors more concerned with steady growth for the long term instead of an exciting company, P&G's history shows that it could be a great buy going forward.


