
Are you an existing or potential investor in 3D Systems (DDD 1.30%)? Then don't miss these eight charts, which should get you up to speed quickly on the leading diversified 3D printing company and its stock.
![]()
Image source: 3D Systems.
Volatile stock performance
The first thing a potential investor in 3D Systems should know is that the company's stock is highly volatile. The following chart shows how 3D Systems' stock has performed over the one-year period through Dec. 23. For context, included are primary rival Stratasys' (SSYS 0.76%) stock performance and the S&P 500's total return.

Data by YCharts.
A stock price rise of 36.3% -- three times the broader market's total return -- is the type of volatility that investors like to see.
However, the story is ugly if we go back a few years. 3D printing stocks hit all-time highs in very late 2013 through very early 2014, so the following three-year chart essentially shows about how much 3D Systems' stock has declined since peaking. (Once again, Stratasys and the S&P 500 are included for context.) The stock's decline in 2014 was largely due to its sky-high valuation coming back down to Earth, while the decline since 2015 has primarily been due to poor business performance.

Data by YCharts.
The 10-year picture is prettier for 3D Systems, but not so for Stratasys.

Data by YCharts.
Business broken down by segment and further
The following chart provides a snapshot of the relative sizes and revenue growth dynamics of 3D Systems' two business units for the first three quarters of 2016. The on-demand 3D printing services operation has held up better than the products business, with 2016 year-over-year revenue contracting 2.1% versus 4% for products. (Unfortunately, 3D Systems doesn't report segment operating income.)
|
Segment | Revenue First Nine Months of 2016 | Percentage of Total Revenue First Nine Months of 2016 |
Revenue Change (YOY) |
|---|---|---|---|
|
Products |
$280.4 million | 60% | (4%) |
|
Services |
$186.6 million | 40% | (2.1%) |
YOY = year over year. Data source: 3D Systems.
In the third quarter, 3D Systems reported the following year-over-year revenue changes. Healthcare solutions, software, and materials were the growth drivers.

Healthcare solutions encompasses both products and services; materials, software, and 3D printers are categories within the products business, and on-demand parts is a services operation. Image source: 3D Systems.
Struggling since 2015 to sell 3D printers
Since the first quarter of 2015, 3D Systems has struggled to grow revenue amid a widespread slowdown in demand for its enterprise 3D printers. Stratasys has suffered the same fate. Stratasys' management has attributed the tepid demand to a glut of 3D printers in the field due to the large number of machines that were purchased in the previous few years, as well as a lengthening of the sales cycles due to an increasing number of product choices.
The following chart shows the abrupt interruption in 3D Systems' and Stratasys' rapid revenue growth dynamics. 3D Systems' brisk growth from 2010 through 2014 was due to its unsustainable, voracious acquisition activity, which likely resulted in its management failing to adequately nurture its existing businesses.

Data by YCharts.
As is typical, 3D Systems' struggle at the top line has negatively impacted its bottom line, leading to earnings losses on a generally accepted accounting principles (GAAP) basis throughout 2015 and 2016.
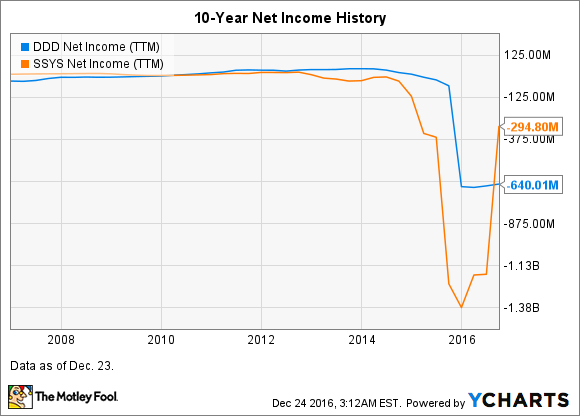
Data by YCharts.
Stock valuation
3D Systems' stock currently doesn't have a price-to-earnings (PE) ratio on a trailing-twelve-month (TTM) basis because the company isn't profitable from a GAAP standpoint. The last time the stock had a trailing PE was in Q1 2015 -- and that was a whopping 225 times earnings! Investors were betting big on a 3D printer boom that failed to materialize, at least as quickly as some expected.
Positively, however, 3D Systems is currently generating a positive free cash flow and cash is a more accurate measure of how well a company's business is performing than earnings, which is just an accounting measure. That said, the stock's P/FCF of 55.9 times is high -- but not nearly as high as rival Stratasys P/FCF of 674!

Data by YCharts.
Looking ahead
While 3D Systems' business in 2016 has shown signs of improvement since 2015, the company's stock price has gotten ahead of its fundamentals, in my opinion. However, this is fairly typical, as the market is a forward-looking machine. What investors are collectively saying is that they see more improvements in 3D Systems' business performance on the horizon.
Part of this optimism likely stems from the fact that relatively new CEO Vyomesh Joshi, who came on board in April, has been making changes aimed at getting the company's growth engine going again. These include exiting certain lines of business (such as desktop 3D printers) and reallocating resources to where top management sees the most potential for long-term growth. This includes the metal 3D printing business and development stage Figure 4 technology, which is a robotic, modular, stereolithography (SLA) 3D printing system that the company claims is 50 times faster than conventional SLA technology.
Going into 2017, what investors and potential investors in 3D Systems should look for when the company reports quarterly earnings is year-over-year improvements in revenue generated from 3D printer sales. This needs to happen for the company's overall revenue growth to get back on a meaningful growth trajectory, in my view. Once revenue growth is back on track, 3D Systems should once again start earning a profit, assuming that it doesn't sacrifice profit margins for revenue growth. Investors can gauge if it might be doing so by monitoring gross margins; we want to see year-over-year gross margins remain at least steady.

