
Here at The Motley Fool, we believe you don't need to be a rocket scientist or overly paid financial professional in order to beat the market. All you need is a little time, patience, and a few Foolish friends to help lead you down the most profitable path. In an effort to do my part, I will be regularly comparing companies against the market itself -- or in this case, the S&P 500. We will first look at the past price performance, and then a few current key metrics in order to make our investment decision.
Today, we will be looking at whether Johnson & Johnson
Past
First, we will take a look at how Johnson & Johnson has performed over the past year.
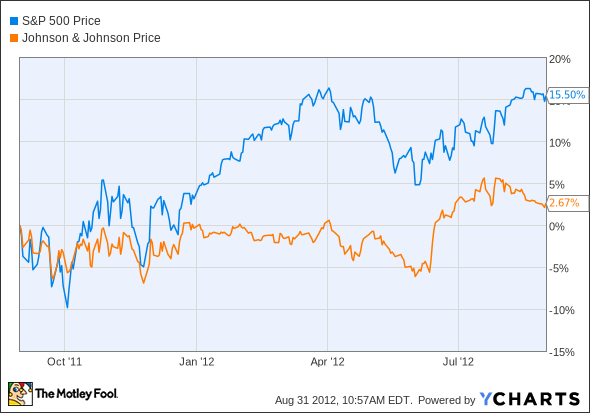
^INX data by YCharts. Dividends not reinvested.
The S&P 500 has easily beat Johnson & Johnson. Had dividends been reinvested, the S&P 500 would have returned 16.7%, while Johnson & Johnson would have only shown an increase of 5.9%. Now let's see who has performed better over a longer period of time.

^INX data by YCharts. Dividends not reinvested; gray area represents U.S. recession.
Over a 10-year period, Johnson & Johnson has still been outperformed by the market. Again, even with dividends reinvested, the market wins -- returning 80.7% compared with only 66.8%. During the most recent recession, the S&P 500 fell much further than Johnson & Johnson, but has recovered nicely. The market has beat Johnson & Johnson by a solid amount for the majority of the past 10 years.
Present
While it is very important to know about the past, current metrics will give us the best indication of whether we have found a future market-beating stock. In order for that to happen, it will need to beat the S&P 500 in these five areas:
- Price/earnings. This ratio is best used when comparing two investments. It simple shows how much you are paying for $1 of earnings. The higher the number, the more expensive an investment. For this exercise, we are looking for a low P/E.
- Dividend yield. The dividend yield is a percentage of the current share price that a company will be sending shareholders. As part owner of a company, you share in the profits. The higher the better, as long as it is sustainable.
- Return on equity. ROE shows how well a company is spending its cash on new business opportunities.
- Net margins. All the revenue in the world doesn't matter if you're not making a profit. Margins tell you how much of the revenue is actually profit -- and we always want more profit.
-
Beta. A company's beta refers to how closely its price movements follow the market's moves. The market is essentially 1; therefore a number higher than 1 indicates wider swings in price than the overall market. Since over long periods of time the market continues to move higher, we want a stock that will move at least with the market, if not faster. For that reason, we will be looking for a beta of 0.85 or higher.
|
Metric |
Johnson & Johnson |
S&P 500 |
Winner |
|---|---|---|---|
| Price/Earnings | 21.40 | 16.22 | S&P 500 |
| Dividend Yield | 3.60% | 1.94% | JNJ |
| Return on Equity (%) | 14.26 | 15.3 | S&P 500 |
| Net Margins (%) | 13.47 | 9.0 | JNJ |
| Beta | 0.48 | 1 | S&P 500 |
Sources: Yahoo! Finance, Business Insider, Multpli.com.
While the S&P is currently cheaper, has a slightly better return on equity, and shows the potential for a higher return in the short run, Johnson & Johnson boasts a better dividend yield and higher net margins.
Foolish investment decision
While I do believe Johnson & Johnson is a great investment on the basis of reliable but slow growth and a large safe source of income, I no longer believe it will beat the market in future years. Due to its low beta, high P/E and past performance, I have changed my CAPScall from a thumbs-up, to a thumb-down. Although I do not recommend Johnson & Johnson, there are plenty of other low beta, safe dividend paying stocks, and you can find some of them here. Be sure to check out this excellent free report by clicking here.


