

Source: Rite Aid
Time and time again taking the long view when it comes to stocks has been a better approach than focusing on the short term, but sometimes taking a long view can be a struggle, particularly when it involves highly volatile stocks like Rite Aid (RAD -56.84%), the nation's third-largest pharmacy retailer.
Rite Aid has had more than its fair share of pops and drops this year. Its share price began the year below $5, traded above $8 in June, and has slid back to $5 in the past month after the company warned that its profit would be less than previously hoped.
Given the company's fits and starts and that there are a lot of opinions flying about, let's look at Rite Aid's financials and see what they say about the company's long term prospects.
Analyzing financial ratios
Digging through corporate financial statements can be time-consuming, but doing so can add clarity to an otherwise cloudy story. I've already taken up Rite Aid's balance sheet and its cash flow statement, but today I'm going to focus on five of Rite Aid's financial ratios. Why? Because financial ratios give investors a quick and dirty overview of the information buried inside a company's quarterly 10-Q.
Current ratio
It's important to know if a company can meet its short-term obligations if debtors come knocking, so let's look at the current ratio first.
The current ratio measures a company's liquidity. It takes a company's current assets (cash, cash equivalents, receivables, inventory) and divides them by the company's short term liabilities (notes payable, current debt payments, payables, accrued expenses, and taxes).
The higher the number, the better able the company is to meet its obligations. In the case of Rite Aid, it current ratio stacks up solidly, outpacing competitors CVS Health (CVS 0.56%) and Walgreen Company (WBA) with a ratio of 1.74. Put this ratio in the plus column for Rite Aid.
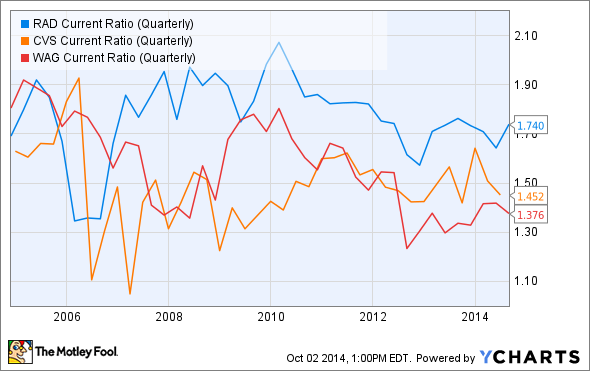
RAD Current Ratio (Quarterly) data by YCharts
Operating margin analysis
Rite Aid gets a check mark for current ratio, but it's also handy to see whether or not the company's cash position is likely to grow, or shrink, in the future. One way to gauge that is by evaluating its operating margin. Operating margin shows you the percentage of sales that a company spends generating those sales.
Operating margin gives investors a great, quick way of seeing just how efficient a business is at turning a profit and it offers a handy way for evaluating how companies in the same industry compare to one another.
In Rite Aid's case, the company's 2.9% operating margin comes up short relative to CVS and Walgreen, but Rite Aid's trend is improving.
After losing money in 2010, restructuring its debt, and closing stores, Rite Aid is making money again and as a result, its operating margin has doubled in the past year. That's the good news. The bad news is that management's recent admission that lower government reimbursement for Medicare and Medicaid patient prescriptions and higher generic drug costs are weighing on profit means that investors should watch this measure closely over the coming quarters.

RAD Operating Margin (TTM) data by YCharts
Free cash flow
I did a deeper dive into Rite Aid's cash flow previously, but to recap: Free cash flow helps investors understand how much money the company has leftover to pay for things such as new stores, acquisitions, and to invest in new services. It's a good way to see if a company's firepower to compete is growing, or shrinking.
At Rite Aid, free cash flow may have increased since 2012, but it's stalled over the past year. The far larger CVS and Walgreen kick off considerably more free cash than Rite Aid, but the fact that Rite Aid's free cash flow trend has been improving is encouraging; especially since Rite Aid will need to start spending on new initiatives like in-store healthcare clinics if it hopes to keep pace with its peers.

RAD Free Cash Flow (TTM) data by YCharts
Price to earnings ratio
Measuring the price investors pay for every dollar of earnings remains a gold standard in evaluating the relative "value" of a stock.
The price to earnings, or PE, ratio is calculated simply by dividing the price of a company's shares by the company's earnings per share. A higher number means you're paying more for every dollar of earnings than a low number.
Ideally, investors (like most people) want a good deal, so they tend to look for low P/E ratios. But a high P/E ratio isn't always bad. Investors often pay more for earnings in industries that are growing quickly, like software, than they do for slow growth groups, like consumer goods.
That suggests that (all other things equal) you shouldn't compare PE's between companies in different industries. Instead, compare the PE for a company relative to where it's been in the past, or relative to a company's industry peers.
At 29.64 on its trailing-12-month earnings, Rite Aid's PE is considerably higher than both CVS and Walgreen's; however, if you use forward analyst earnings projections the gap between Rite Aid and its peers narrows. Of course, investors should remember that analyst earnings estimates are ripe for revision, so take them with a grain of salt.

RAD P/E Ratio (Forward) data by YCharts
Price to sales ratio
In addition to knowing how much you're paying for every dollar of earnings, it's also helpful to see how much you're paying for every dollar of sales. Similar to the PE ratio, high growth businesses are usually rewarded with high price to sales, or PS ratios, so it's most useful to consider the PS ratio relative to itself, or industry peers.
By this measure, investors are paying far less for Rite Aid's revenue than they are for CVS and Walgreen's. That could be because investors remain skeptical that Rite Aid's profitability will continue. Regardless, assuming that Rite Aid's profits eventually find their footing and start growing again, the PS ratio suggests there could be some value in buying shares.

RAD PS Ratio (TTM) data by YCharts
Fool-worthy thoughts
It's dangerous for investors to put too much emphasis on any one financial ratio. Focusing on price to sales, for example, absent of knowing price to earnings, could mean ending up with a company that's going bankrupt.
Instead, investors should use a basket of financial ratios to reach their own conclusion. Based on the above ratios, I'm willing to bet that Rite Aid's stumbles are short term and that its financials will improve over time.


