A multiyear rebound in the housing market has sparked a huge rally for the two main home improvement retailers, Lowe's (LOW -0.03%) and Home Depot (HD 0.02%). Their stocks are both trouncing the broader market since 2011 as sales and profits set new records.
Yet a closer look at the businesses reveals important differences between the companies that investors should know before they choose one stock over the other.
Here's how the retailers stack up against each other in five key metrics:
|
Metric |
Home Depot |
Lowe's |
|---|---|---|
|
Market cap |
$170 billion |
$68 billion |
|
Sales growth |
7.1% |
5.1% |
|
Net profit margin |
7.9% |
4.2% |
|
Dividend yield |
2% |
1.5% |
|
Forward P/E |
19 |
16 |
Sales growth is for existing U.S. locations. Profit margin is for the 2015 fiscal year. Data source: Company financial filings and S&P Global Market Intelligence.
Growth trends
Home Depot is growing at a much faster pace despite its larger sales footprint: Comparable-store sales improved by 7% last year while Lowe's managed just a 5% gain. The market leader benefited from higher demand across all of its product categories, but big-ticket purchases (appliances, roofing, contractor services) led the way.
Home Depot achieved this outperformance mainly through increased customer traffic, which gives it a lot of flexibility as it looks to keep results churning higher. The retailer handled 1.5 billion transactions last year for a 4% rise over 2014. Lowe's traffic gain, meanwhile, was 2%.

Looking ahead, Home Depot's management aims to continue its market-thumping growth in 2016 by dominating the $180 billion consumer segment while expanding into a professional customer niche that's nearly as big ($120 billion).
Efficiency trends
Home Depot is also the clear winner when it comes to financial efficiency. Its profit margin and return on invested capital figures are both more than double its smaller rival's:

HD Profit Margin (TTM) data by YCharts.
Over the longer term, HD executives expect their operating margin to climb to 15% by fiscal 2018 while ROIC jumps to 35%. The retailer's push into serving professional customers should help it achieve that aggressive goal.
Capital returns and valuation
Finally, Lowe's comes out ahead of Home Depot on two important metrics. First, it has a better track record at protecting its dividend through market downturns. Home Depot shareholders had to wait for three years between payout hikes during the worst of the housing market crisis even as Lowe's kept its dividend ticking higher. Thus, Lowe's status as a dividend aristocrat, plus its allocation of just 35% of profit to dividend payments (vs. 50% for Home Depot) might make it a better choice for conservative income investors. Aggressive income seekers, though, will likely find its heftier payout target attractive.
Second, Lowe's is the cheaper stock. Investors need to fork up 22 times this year's earnings to own Home Depot, compared to 19 times for Lowe's. The gap is even wider with regard to sales: You'll have to pay twice Home Depot's $88 billion of annual revenue for that business but just 1.2 times sales for Lowe's.
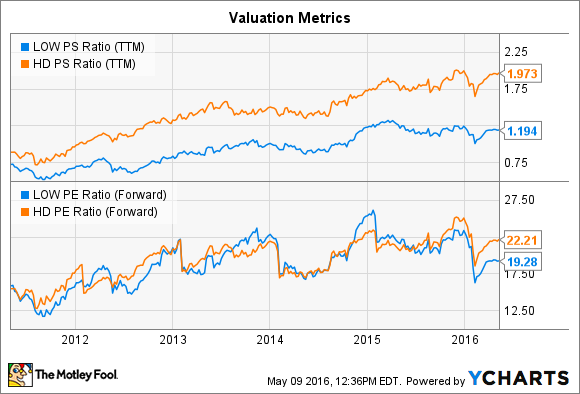
LOW PS Ratio (TTM) data by YCharts.
But thanks to a long track record of outperformance with regard to market share gains and operating efficiency, it makes sense that Home Depot's stock would carry a premium over its competitor. With the key growth trends pointing in its favor, it seems likely that, while both stocks should do well in a continued housing market recovery, Home Depot's will keep outpacing Lowe's.


