

Image source: Under Armour.
The past month has been an interesting ride for Under Armour (UAA 0.74%) shareholders.
On April 21, the athletic apparel maker announced revenue and operating growth of 30% and 26%, respectively. It was the company's 24th consecutive quarter of revenue growth in excess of 20%. Shareholders reacted accordingly, driving the stock price up 7% the day after its earnings call.
Since then, the company has locked up Washington Nationals star Bryce Harper to a multi-year sponsorship extension. The face of UA Basketball Steph Curry made Time magazine's list of 100 most influential people, suffered what appeared to be catastrophic knee injury, came back in two weeks, helped his team defeat the Portland Trailblazers in the playoffs, and became the first player in NBA history to become a unanimous MVP.
There was some bad news, too. The company's chief merchandising and chief digital officers left the company. After news of the key executives' departure, the market gave up its prior gains and then some. Since the initial earnings pop, the stock is down 21% in under a month.
Let's take a closer look to see if the price drop is justified, or if investors are getting a gift.
Paying up for growth
A company that has grown its top line over 20% per year for six consecutive years is usually not going to trade at bargain prices. In fact, Under Armour hasn't traded at a P/E ratio below 30 since the peak of the financial crisis.
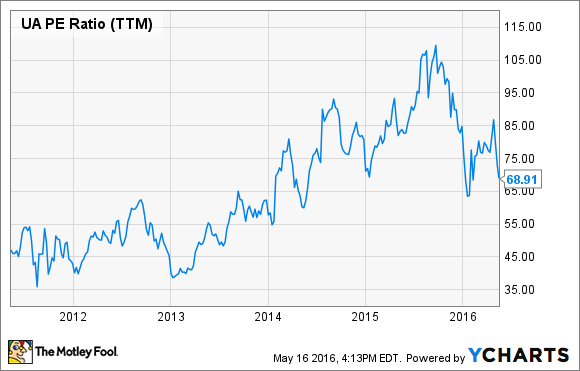
UA P/E Ratio (TTM) data by YCharts.
Today, the company trades at nearly 70 times trailing earnings, a multiple well off its highs, but certainly not cheap by traditional measures.
Sacrificing profits
Traditional valuation measures like the trailing P/E ratio is not the ideal way to measure a high-growth company like Under Armour. The company has taken several steps that temporarily depress earnings and, hence, increase the P/E ratio.
Two areas of growth Under Armour has focused on are its international and digital businesses. In the first quarter, Under Armour reported 65% international growth on a currency neutral basis. However, a strong dollar took away 9% of that revenue growth. The company did not report the negative effect currency had on total income, but it did cause a decline of 70 basis points on gross margins.
As for its Connected Fitness business, which includes the MyFitnessPal, Endomondo, and MapMyFitness apps along with the UA Health Box, Under Armour more than doubled revenue. However, the company continued to see large losses as it aggressively ramps up its digital business.
|
Quarter ended March 31, 2016 |
Quarter ended March 31, 2015 |
% Change | |
|---|---|---|---|
|
Connected Fitness revenue |
18,501 |
8,431 |
119.4% |
|
Connected Fitness net income (loss) |
(16,461) |
(15,036) |
(9.5%) |
Revenue numbers in thousands of USD. Data source: Company filings.
Losses at connected fitness had a negative $0.04 per share impact on the bottom line, a significant amount considering the total income per share for the company in Q1 was exactly $0.04 per share.
Under Armour also gave up some income gains by aggressively growing inventory. In the first quarter inventory increased 44% while revenue increased 30%. Inventory levels consistently increasing more than sales is typically a negative sign for a retailer as it opens the business up to obsolescence and future markdowns. Higher inventory levels also have a negative effect on gross margins. However, the move was strategic for Under Armour as the company aimed to make its products available to its customers in a more timely fashion.
As the Connected Fitness business takes off, Under Armour will be able to collect more data on customer preferences, thus allowing it to better manage inventory. The company is also investing heavily in a SAP enterprise resource application. According to management, the investment in SAP will help "revenue growth, inventory optimization, improve service levels, and effectively manage margins."
Finally, the company is spending aggressively in selling, general, and administrative expenses. SG&A expense increased 27% in the first quarter to $446 million. The primary drivers of the increase were investments in its direct-to-consumer business, which increased 33%, and a bump in overall headcount to support the company's strategic initiatives.
While revenue grew 30%, operating income grew at a slower rate. As a result, profit margins the last 12 months were only 5.7%, an amount considerably lower than most of its competition.
|
Company |
Net Profit Margin (TTM) |
|---|---|
|
Under Armour |
5.7% |
|
Nike (NKE -0.36%) |
11.8% |
|
lululemon athletica (LULU 2.64%) |
12.9% |
|
Adidas |
4.4% |
Data source: YCharts.
However, the increased spending drove revenue growth in key business lines. At this stage of Under Armour's business, revenue trumps growth as it tries to close the gap between itself and Nike.
Valuation
Since a price multiple looking at past earnings is not a sufficient way to measure Under Armour's valuation, I like to look at the business a couple of different ways. Growth stocks are often very difficult to value, and this one is no different. However, let's give it a shot.
Under Armour has given revenue guidance of $7.5 billion for 2018. The company is currently on pace to crush that number. The company ended 2015 at just under $4 billion in revenue. To get to $7.5 billion, Under Armour will have to grow revenue at about 24% annually. It has grown more than 30% the last two quarters and has not seen sub-24% growth since the second quarter of 2013. With the momentum in its basketball, international, and digital businesses, I believe 24% growth is conservative. In fact, the company itself raised guidance for 2016 to 26%. Under Armour is traditionally conservative with guidance, but I believe a 26% growth rate to 2018 is reasonable. This brings total revenue to just above $7.9 billion. If growth slows down to 20% for the two years after 2018, total revenue at the end of 2020 is estimated to be $11.4 billion.
By the end of 2020, I do expect Under Armour to continue to invest in its growth, but it may be taking some weight off the pedal. If the company can muster a net profit margin of 7.5%, still well below Nike, the company may deliver the following performance.
|
2015 |
2020 (Est.) | |
|---|---|---|
|
Total Revenue |
$3,963 |
$11,416 |
|
Net Income |
$232.6 |
$856.2 |
|
Shares Outstanding (adjusted for 2:1 split) |
431.0 |
476.8 |
|
Earnings per Share |
$0.54 |
$1.80 |
All numbers in millions of USD. Data sources: Company filings and author's calculations.
Using a share dilution rate of 2%, I am estimating 2020 earnings of $1.80 per share. Assuming a P/E ratio between 25 and 45, shares at today's price of $37 appear to be reasonably priced to undervalued.
|
Future P/E Ratio |
Estimated Price Per Share |
5-Year Annualized Return |
|---|---|---|
|
25 |
44.89 |
4% |
|
35 |
62.85 |
11% |
|
45 |
80.80 |
17% |
Data source: Author's 2020 estimates.
Another quick and dirty method of valuing Under Armour involves using its largest competitor as a yardstick. Nike is currently hovering around a $100 billion market cap. Under Armour has high ambitions to become No. 1, but that's a difficult goal to reach, and it may never happen.
Today, Under Armour is a $16 billion company. An optimistic investor may believe Under Armour can be a third of Nike's size in five years. A double from today's price translates to 15% annualized returns. If it takes 10 years to get there, annualized returns are closer to 7%, which isn't too shabby.
Bottom line
Growth stocks like Under Armour can move quickly in either direction. Although I believe my estimates to be reasonable, the future is difficult to predict. A global recession, a major injury or public relations nightmare by one of Under Armour's athletes, or failure to translate revenue into profits, may prove my estimates to be aggressive. Alternatively, something like Steph Curry's increasing global popularity or higher-than-expected growth in connected fitness may prove my estimates to be conservative.
Given the company's ability to deliver consistent top-line growth and ability to choose brand ambassadors that perform at a high level, I'm leaning toward the latter.


