Annualized volatility measures how much a stock price varies over one year. Many investors use volatility to define the riskiness of a stock, bond, or asset class. In addition, assumptions about volatility are used to price options.
No investor invests without comparing risk to reward, so annualized volatility is integral to any investor's toolbox. We'll outline how to calculate volatility and provide an example to serve as a reference point for readers interested in the concept.
What is volatility?
What is volatility?
The most common way to measure volatility in finance is through standard deviation. This is a mathematical expression of how much a variable can differ from its average.
To help investors grasp the concept of volatility, consider investing in two funds. Fund A has returned 10% each year over the last three years. Fund B has returned 8%, 12%, and 10%.
Both funds have an average yearly return of 10%, but Fund B is more volatile because its returns vary more. Using a simple Excel worksheet and the standard deviation function (stdev), you can see that Fund A's standard deviation is zero (meaning its returns don't vary around the mean). In contrast, the standard deviation for Fund B is 2%.
Assuming a normal distribution -- a bell-shaped curve that assumes 68% of variables are within one standard deviation from the mean and 95% of variables are within two standard deviations -- you could argue the following for Fund B:
- 68% of the time, the fund will generate a return between 8% and 12%.
- 95% of the time, the fund will generate a return between 6% and 14%.
The above example is simplified to illustrate a point. However, in the real world, investors won't always have the time or patience to wait years to calculate potential returns and volatility.
That's where the idea of annualized volatility comes in. By annualizing short-term data, investors can know how volatile a stock will be over the course of a year just by using the data. In this case, I will illustrate the concept by examining the monthly returns on two U.S.-listed stocks.
Annualized volatility formula
Annualized volatility formula
But first, here's a look at the formula for calculating annualized volatility.
- Annualized volatility = standard deviation (volatility) multiplied by the square root of the periods in the year.
For example, you might calculate the volatility of daily stock returns. Since there are roughly 252 trading days in the year, you multiply the square root of 252 (15.9) by the daily volatility to get the annualized volatility. (We'll use monthly returns in the case below, so the time period will be 12 times a year.)
Calculating volatility
Calculating a stock's volatility
The chart below shows the monthly returns for two stocks. Just from the chart's appearance, Stock A is more volatile than Stock B, but this needs to be expressed mathematically.
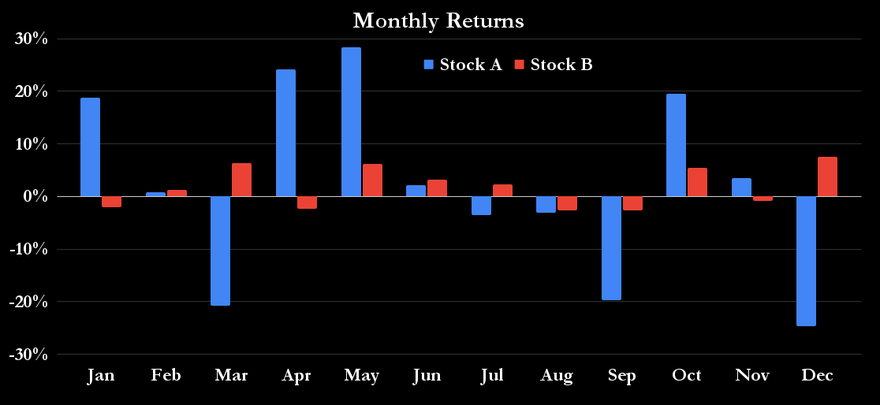
The first step is to calculate the monthly volatility of each stock's return. You can easily do this using an Excel spreadsheet and calculating the standard deviation (stdev function) of the 12 monthly returns for each stock, as shown in the chart above.
Doing this gives a monthly standard deviation (volatility) of 17.9% for Stock A and just 3.6% for Stock B. This confirms the optics in the chart. In other words, Stock A is a more volatile -- and, some might say, riskier -- investment than Stock B.
Annualizing volatility
Annualizing volatility
Returning to the formula for annualized volatility, the figures above are monthly returns. There are 12 months in the year, so the annualized volatility is calculated by multiplying the square root of 12 by the monthly volatility. Here's how we calculate annualized volatility for the two stocks:
- Stock A annualized volatility = 17.9% multiplied by the square root of 12, resulting in 62%
- Stock B annualized volatility = 3.6% multiplied by the square root of 12, resulting in 12.5%
We can see that Stock A is notably more volatile than Stock B, which might be a factor to consider when investing in stocks.
The bottom line on calculating annualized volatility
It's important to remember that annualized volatility is just one of many tools investors must consider. The history of investing is full of investment strategies that demonstrated low volatility and good returns -- right before they blew up in an investor's face.
In addition, the data is always historical, and there's no guarantee that stock returns will follow historical patterns. The assumption that volatility or standard deviation is equivalent to risk is also an open question.
Related investing topics
For example, going back to the first example above, Fund B is seen as riskier because its returns are more volatile than Fund A. However, the implied annual return is precisely the same at 10% for both funds. All told, volatility and annualized volatility are simply useful concepts that can serve as a starting point for thinking about risk and reward in investing.
FAQ
How to calculate annualized volatility: FAQ
What is the formula for annualized volatility?
The formula for annualized volatility is the standard deviation of the data multiplied by the square root of the number of time periods in the year the data is collected (i.e., 12 for a monthly collection).
How is volatility calculated?
Volatility is calculated using a standard deviation.
What is annualized volatility used for?
Annualized volatility is often used as a benchmark for measuring the volatility of a stock or an asset as part of putting together a risk profile for that stock or asset.