3 Most Important Financial Statements
Emotions in Investing: How to Manage Stock Market Anxiety & Stress
Futures Trading: Everything You Need to Know
For Investors: Business Valuation 101
11 Up-and-Coming Stocks to Invest In
When to Sell Stocks — for Profit or Loss
Accounts That Earn Compounding Interest
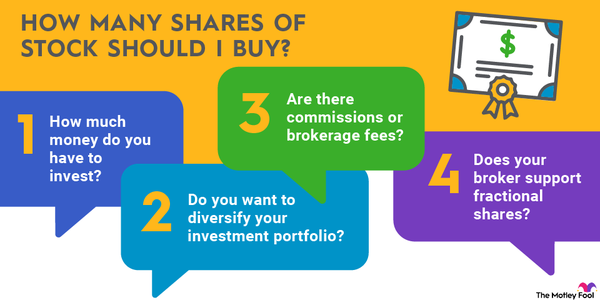
How Many Shares Should I Buy of a Stock?
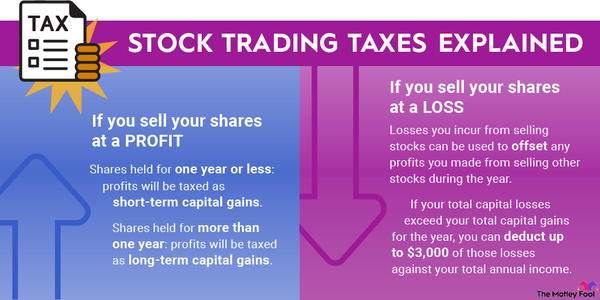
Selling Stock: How Capital Gains Are Taxed
Market Order vs. Limit Order
How Are Stock Prices Determined?
What Is a Good Return on Investment?
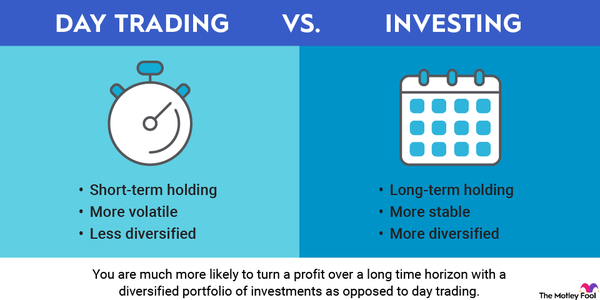
Day Trading Definition: Why It Differs From Investing
The Definitive Guide: How to Value a Stock
What Happens When a Stock Is Delisted?
GAAP vs. Non-GAAP: Everything You Need to Know
Best Time of the Day, Week, and Month to Trade Stocks
A Beginner's Guide to Understanding Financial News
Technical Analysis for the Long-Term Investor
How to Calculate Cost Basis for Inherited Stock
What Are Share Repurchases?
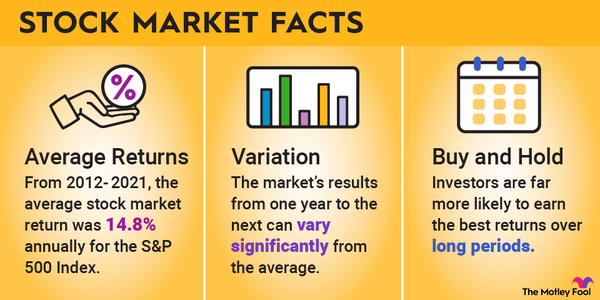
Average Stock Market Return
Stock vs. Share: What's the Difference?
How to Find Investment Ideas
Investment Strategies for the Long Term
What is the Difference Between Simple & Compound Interest?
Why Is It Important to Invest in Stocks?
What Makes a Stock Price Go Up?
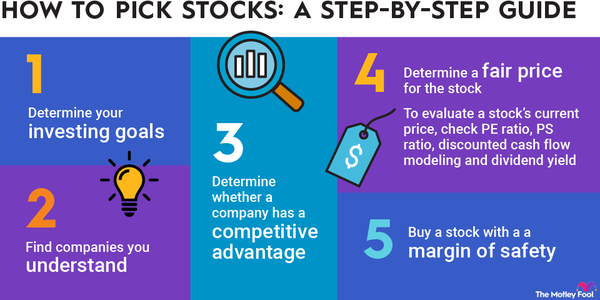
How to Pick a Stock for the First Time
Can You Owe Money on Stocks?
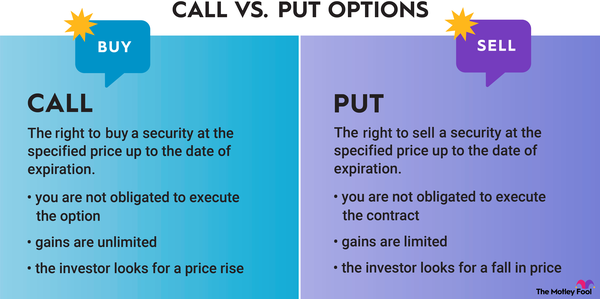
Options vs. Stocks: What's the Difference?
Taxes on Investments: Understanding the Basics
How Many Stocks Should You Own?
Socially Responsible Investing
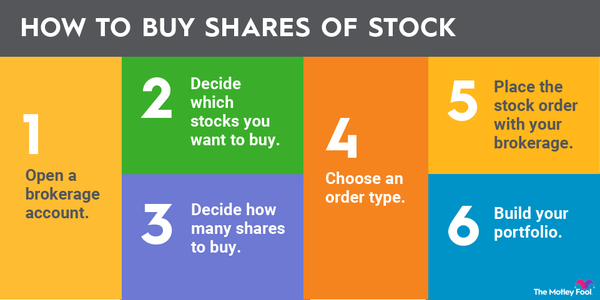
How to Invest in Stocks: A Step-by-Step Guide
How to Calculate Volatility of a Stock
How to Calculate Total Stock Returns
How to Calculate Take-Home Pay
How to Invest in Amazon Stock
How to Invest in Tesla Stock in 2024
How to Invest in Microsoft Stock
How to Buy Nvidia Stock (NVDA)
How to Invest in Disney Stock
How to Invest in Google Stock
How to Invest in Berkshire Hathaway Stock
How to Invest in Johnson & Johnson Stock
How to Invest in Exxon Stock
How to Invest in Facebook Stock (META)
How to Invest in Apple Stock
How to Invest in Databricks
How to Invest in Epic Games
How to Invest in Ford Stock
How to Invest in PayPal Stock
How to Invest in Etsy Stock
How to Buy Pinterest Stock in 2024
How to Invest in Block Stock
How to Invest in SpaceX in 2024
How to Invest in Mistral AI in 2024
How to Invest in Shopify in 2024
How to Invest in Costco in 2024
How to Invest in Netflix in 2024
How to Invest in Aldi in 2024
Here's How to Calculate Future Expected Stock Price
Converting Daily Returns to Annual Returns: Formula, Process, and Example
Million-Dollar Portfolio: How to Get There
Best Master Limited Partnership Stocks to Buy in 2024
Upcoming Stock Splits to Pay Attention to
Apple's Stock Split History
Futures vs. Options: What's the Difference?
Understanding the Differences Between GAAP and IFRS
How to Invest in Reddit Stock
How to Invest in Coca-Cola Stock (NYSE:KO)
How to Invest in Twilio Stock
How to Buy Upstart Stock (UPST)
How to Invest in Intuitive Surgical
How to Invest in Carnival Cruise Lines
How to Invest in Rivian (RIVN)
How to Invest in SoFi Stock
How to Invest in CRISPR Therapeutics Stock
How to Invest in Advanced Micro Devices
How to Invest in Nu Holdings
How to Invest in Palantir Technologies Stock
How to Invest in Coinbase Stock
How to Invest in AT&T Stock
How to Invest in Pepsi Stock
How to Invest in Walmart (NYSE:WMT)
How to Invest in Palo Alto Networks Stock
How to Invest in Arm Stock
How to Invest in Instacart
How to Invest in Klarna Stock
How to Invest in The Boring Company
How to Invest in Rippling Stock Pre-IPO
How to Invest in Blue Origin
How to Invest in Upside Foods Pre-IPO
Neuralink Stock: How to Invest Before the IPO
Investing in Ripple Stock
How to Invest in Fanatics Stock
How to Invest in Chime Stock
How to Invest in Impossible Foods
How to Invest in Forge Global
How to Invest in Tilray Stock
How to Invest in General Electric (GE)
How to Invest in Northrop Grumman (NOC)
How to Invest in Bank of America
How to Invest in QuantumScape
How to Invest in Lockheed Martin
How to Invest in Birkenstock
How to Invest in Snowflake
How to Invest in Taiwan Semiconductor
Your Guide to Investing: "Magnificent Seven" Stocks
How to Invest in Liquid Death
How to Invest in Northvolt
How to Invest in Flexport in 2024
How to Invest in Verizon in 2024
How to Invest in Skims in 2024
How to Invest in Waystar Technologies
How to Invest in BMC Software
How to Invest in Unity Software
How to Invest in Canopy Growth
SHEIN IPO: Investing in SHEIN
How to Invest in Panera Bread
How to Invest in Starlink in 2024
How to Invest in Deloitte
How to Invest in Mars Stock
How to Invest in H-E-B Grocery
What Does Procter & Gamble Own?
Buying Trader Joe's Stock: Is It Public?
How to Invest in the Lego Company
How to Invest in Hulu Stock
How to Invest in Arctic Wolf
How to Invest in Rubrik Pre-IPO
How to Invest in ServiceTitan Pre-IPO
How to Invest in Checkout.com Pre-IPO
How to Invest in Plaid Pre-IPO
How to Invest in Redwood Materials Stock
What Happens to the Ownership of Stocks After a Person Dies?
How to Invest in American Airlines
How to Invest in United Airlines
How to Invest in Turo Pre-IPO
What Companies Does Amazon Own?
What Does Berkshire Hathaway Own?
What Companies Does SoftBank Own?
What Does Google (Alphabet) Own?
What Companies Does Microsoft Own?
What Companies Does Johnson & Johnson Own?
What Companies Does Apple Own?
What Companies Does Mondelez Own?
Who Owns Amazon? Largest Shareholders
How to Invest in Airbnb (ABNB)
How to Invest in Chevron (CVX)
How to Invest in Ascend Elements
Who Owns X (Formerly Twitter)?
How to Buy Stocks on Behalf of an LLC
How to Invest in Eli Lilly (LLY)
How to Invest in Novo Nordisk (NVO)
How to Invest in MercadoLibre (MELI)
How to Invest in Figure AI Pre-IPO
How to Invest in Cerebras Pre-IPO
How to Invest in StubHub Pre-IPO
How to Invest in Perplexity Pre-IPO
How to Invest in Boston Dynamics
How to Invest in Telegram
How to Invest in Valve Pre-IPO
Who Owns Bank of America?
Stock Market Holidays & Early Closures in 2024
Alpha vs. Beta: When to Use Which Metric?
How to Invest in Lucid Group (LCID)
How to Invest in Anduril Pre-IPO
How to Invest in Truth Social