The Sharpe ratio is a measure used to gauge the return of an asset when adjusted for the risk taken onboard. The word "asset" encompasses a wide range of financial instruments, but the most common use of the Sharpe ratio is to compare funds and the performance of fund managers. You can use it in your investing to see how you match up with fund managers. Here's how to use the Sharpe ratio to improve how you allocate money.

What is the Sharpe ratio?
What is the Sharpe ratio?
The ratio is defined as the annual return of a portfolio (Rp) minus the risk-free rate (Rf) divided by the standard deviation of the asset's excess returns. I've used italics to emphasize that it's not the standard deviation of the asset's returns (Rstdev) being measured but the asset's returns over and above the risk-free rate – a common error made when looking at the ratio.
Simply put, the Sharpe Ratio= (Rp – Rf)/Rstdev
The portfolio return is the average annual return of the portfolio. At the same time, the risk-free rate is usually taken as the return on a very secure asset such as a 10-year U.S. Treasury bill. The risk in the portfolio is measured using standard deviation, a mathematical expression of how much excess returns deviate from their average over time. A higher standard deviation implies a riskier investment than a lower investment.
A fund with a higher Sharpe Ratio implies a relatively higher return for the risk taken on board than a fund with a lower Sharpe ratio.
Examples
Worked examples of the Sharpe ratio
The following examples illustrate how the Sharpe ratio might be used to compare investors. To simplify matters, let's assume the risk-free rate (Rf) is 4% and constant across each year. The table shows that Fund A's average annual return (Rp) is higher than Fund B's. However, a visual inspection suggests Fund A's excess returns deviate far more from its average than Fund B's. This is confirmed when calculating the Rstdev (using the STDEV function in a spreadsheet).
Fund A Rstdev = 17.4%
Fund B Rsdev = 3.6%
| Annual Returns | Year 1 | Year 2 | Year 3 | Year 4 | Year 5 | Average Return (Rp) |
|---|---|---|---|---|---|---|
| Fund A | 22% | 3% | 7% | (12)% | 33% | 10.6% |
| Fund B | 7% | 12% | 14% | 7% | 8% | 9.6% |
Using the data and the Sharpe ratio equation above,
- Fund A's Sharpe ratio = (10.6% – 4%)/17.4% = 0.38
- Fund B's Sharpe ratio = (9.6% – 4%)/3.6% = 1.55
In other words, even though the average return of Fund A is higher than that of Fund B, its Sharpe ratio is much less due to variance around its results. According to the Sharpe Ratio methodology, investors are better compensated for the risk taken by the fund in Fund B, even though its average returns are lower over the period.
Limitations
Limitations of the Sharpe Ratio
Although it's a helpful tool to try and eliminate funds and fund managers that have generated outsized returns by continually taking on excess risk, the ratio could be better. It should only be used in combination with several qualitative and quantitative assessments.
For example, it's entirely possible to generate an excellent Sharpe ratio in periods when the market favors a fund's sector bias or investment style -- only to walk into severe drawdown when, say, the housing or tech sector bust occurs, or conditions are no longer suitable for trend following or mean reversion investment strategies.
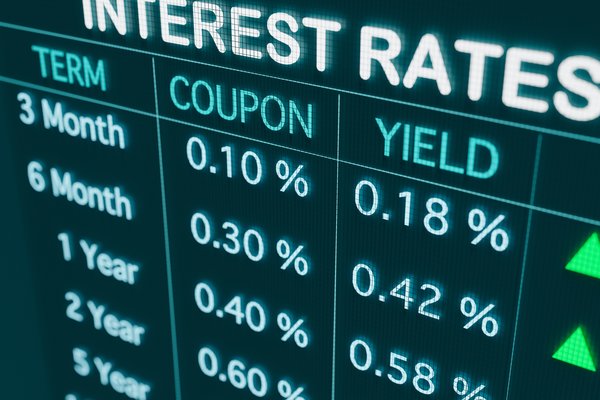
Similarly, the fact that interest rates (the risk-free rate, Rf) are used to calculate the Sharpe Ratio doesn't tell you much about how the fund might perform when interest rates have significantly changed from when the ratio was calculated.
Standard deviation is also subject to significant criticism as a measure of risk.
Related investing topics
How to use it
How to use the Sharpe ratio
The ratio is just one of an arsenal of tools investors should use to measure performance, but it still has its uses, especially if you can use long-term data over different market periods.
For example, Warren Buffett's Berkshire Hathaway's 15-year historical Sharpe ratio was an impressive 0.97 compared to the S&P 500's 0.58 and Carl Icahn's Icahn Enterprise's 0.49. This suggests that investing in Buffett generates significantly better returns for the risk than investing with Icahn and the S&P 500 over the long term.