
Shares of Under Armour (UAA 0.92%) (UA 0.95%) have plunged about 45% over the past year, due to a combination of peaking sales growth, narrowing margins, a lofty valuation, executive turnover, and questionable management decisions.
I examined Under Armour's biggest problems in a recent article and concluded that the company will likely face more pain in the near future. But to give investors a clearer look at those problems, these six charts best illustrate the severity of the company's challenges.

Image source: Under Armour.
1. Its slowing revenue growth
Looking back at Under Armour's revenue growth since its IPO in 2005, it's easy to see why the athletic apparel and footwear maker was once a Wall Street darling.
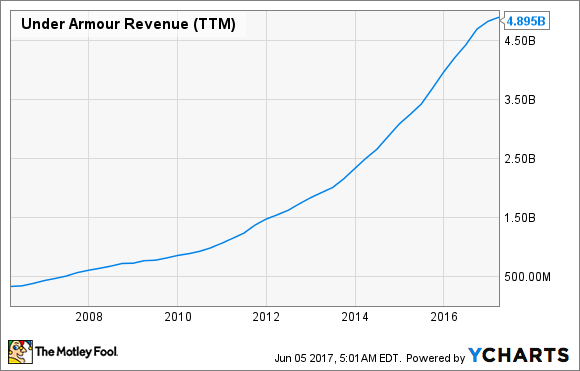
Data by YCharts.
However, that love affair promptly ended when the growth slowed. After rising 29% in 2015 and 22% in 2016, Under Armour revenue is expected to grow just 11% to $5.35 billion this year.
Back in 2015, CEO Kevin Plank claimed that UA could generate $7.5 billion in annual revenue by 2018 -- which would now require 40% growth from 2017 estimates. It doesn't look like the company can reach that goal, but Plank isn't giving up yet.
2. Its dependence on North America
Another problem for UA is its overwhelming dependence on the North American market, as seen in the following breakdown of its first quarter revenue:

Data source: UA quarterly report. Chart by author.
The North American market was the only region to post negative annual sales growth last quarter, due to sluggish traffic in brick-and-mortar stores, tougher competition from Nike and Adidas, and the bankruptcy of Sports Authority last year.
This also leaves Under Armour extremely vulnerable to any new border taxes on imports since it manufactures nearly all of its products overseas.
3. And a growing dependence on footwear
The company also faces a disadvantageous shift in its product mix as lower-margin footwear replaces higher-margin athletic apparel. This move pushes it into direct competition against Nike and Adidas, which both have superior branding, scale, and marketing budgets.

Q1 2013 vs Q1 2017 revenue breakdown. Data source: Under Armour. Chart by author.
You'll also notice that Under Armour's widely hyped "connected fitness" business -- which was aimed at challenging Fitbit with an ecosystem of connected apps, wearable devices, and smart clothing -- accounts for just 2% of its top line.
4. How the connected fitness business measures up to Fitbit
If we compare Under Armour's connected fitness unit to all of Fitbit, we notice two things. First, Fitbit generates a lot more revenue from wearables, and second, both businesses are losing money due to tough competition.

Data source: UA and Fitbit. Chart by author.
The operating losses UA took on its connected fitness business last quarter contributed heavily to its net loss of $2 million -- which represented its first-ever quarterly loss.
5. Declining operating margins
To counter its slowing sales and rising competition, UA is spending more on securing big endorsers, developing new products, and launching massive marketing campaigns against Nike and Adidas.
But at the same time, its dependence on lower-margin products is growing, and it's still sinking money into its mediocre connected fitness segment. Those issues caused the deterioration of its operating margins over the past decade.

Data by YCharts.
UA hopes to counter this margin contraction with the "premiumization" of its high-end products. But that strategy is a tough sell -- if demand for a company's products is slowing down due to tough competition, hiking up prices could drive away customers instead of luring them in.
6. A lofty valuation
Under Armour bulls will likely claim that the stock looks fairly valued or cheap based on its historical valuation levels. That statement is partly true as you can see in the P/E chart below:
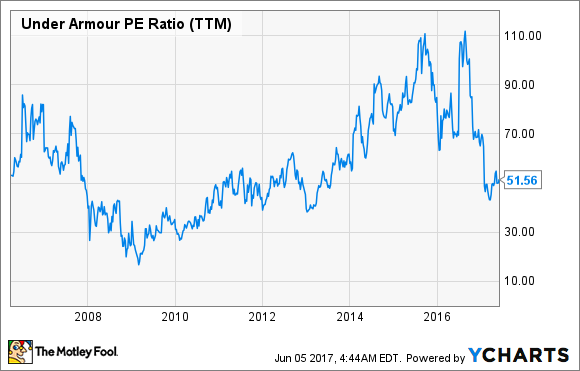
Data by YCharts.
But you should also notice two things. First, Under Armour stock is trading at roughly the same multiple as it was back in 2013 -- when its sales and earnings growth were accelerating, not decelerating. Second, its current P/E of about 50 is well above the industry average of 23 for apparel manufacturers, meaning it is still a very pricey play even at these beaten down prices.
The key takeaways
I believe that some investors have fallen in love with the story of Under Armour, the company which was repeatedly dubbed the "next Nike" during its rapid growth phase. But if we take off those rose-tinted lenses, it appears Under Armour faces too many major headwinds to qualify as a slam dunk investment.


