
In the global athletic apparel space, it's Nike (NKE 0.19%) and Adidas (ADDYY -0.07%) and then everyone else.
For years, the two giants have towered above a field of smaller competitors in terms of sales, profit, cash flows, and market capitalization, just to name a few financial metrics; Under Armour (UA -0.15%) (UAA 0.22%) deserves mentioning here.
And while Nike remains far larger than Adidas in these metrics and has for some time, it also bears noting that Adidas shares have handily outpaced its apparel rival over the past year.
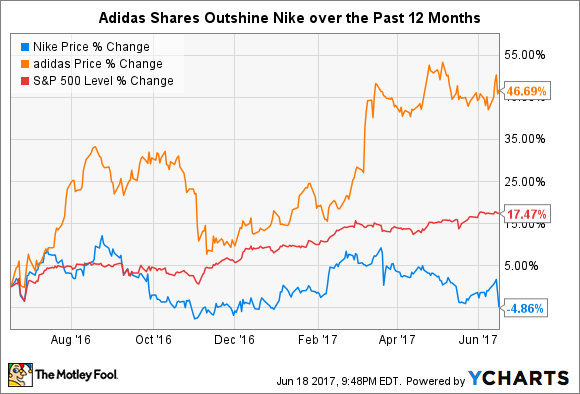
Admittedly, charts like this only speak to where a company has been, as opposed to where it is headed. As such, this article will examine Nike and Adidas via a three-part analysis designed to determine which athletic giant's stock appears to be the better buy today.
Financial fortitude
Investors need to have a handle on any prospective company's financial position as a jumping off point. As such, here is a quick overview of four of the most important measures of liquidity and solvency for the two athletic apparel giants.
|
Company |
Cash & Investments |
Debt |
Cash From Operations |
Current Ratio |
|---|---|---|---|---|
|
Nike |
$6.1 billion |
$3.5 billion |
3.9 billion |
3.1 |
|
Adidas |
$2.1 billion |
$2.6 billion |
$1.2 billion |
1.3 |
Data source: Yahoo Finance
Here, Nike earns a clean sweep. As a brief matter of semantics, I prefer to combine companies' cash and investments and debt into a single net-cash figure. Seen this way, Nike's $2.6 billion in net cash compares quite favorably to Adidas' -$500 million in net cash. Equally impressive, Nike easily bests Adidas in terms of its cash flow generation capabilities and its ability to meet its near-term financial obligations.
Importantly, Adidas remains in perfectly fine financial shape as well. However, Nike's relative advantages here are without question, so let's score one for Nike and move on.
Winner: Nike

Image source: Adidas.
Durable competitive advantages
Given their overwhelming similarities, it should come as no surprise that both Nike and Adidas enjoy comparable competitive advantages. Though they have many positive characteristics, both companies' globally recognizable brands serve as the chief source of competitive advantage for Nike and Adidas.
According to global brand consultancy Interbrand, Nike enjoyed the 18th most valuable brand in the world with an estimated brand value of $25 billion in 2016. Meanwhile, Adidas ranked 60th with an estimated brand value of $7.8 billion.
The two companies implement a well-functioning sponsorship model, in which they sign top athletes to around the world including LeBron James (Nike), Roger Federer (Nike), Novak Djokavic (Adidas), Lionel Messi (Adidas), and hundreds more. Seeing these icons compete at the highest levels of global athletics in Nike and Adidas gear creates a powerful, aspirational effect for Nike and Adidas. This translates to pricing power for these two companies, which each consistently produce gross margins in the mid-to-high 40% range.

NKE Gross Profit Margin (TTM) data by YCharts
In recent years, Under Armour has successfully mimicked this playbook, signing names like Jordan Spieth and Stephen Curry. Adding a new and capable competitor like Under Armour into the ranks of the world's athletic apparel elite has added competition to sign top-notch athletes, but it has not upended the overall value proposition for either Nike or Adidas.
Recall that Nike, Adidas, and Under Armour are ultimately selling shoes and shirts, which would normally would be considered at least somewhat commodity goods. As such, the fact that the two are able to operate with this degree of pricing power certainly suggests that a fairly wide moat exists around this kind of business mode.
Winner: Tie
Valuation
Turning to the final leg of this investment triathlon, let's quickly review the multiples at which the market currently values Nike and Adidas shares. To do so, take a look at these three popular measures of share price valuation for the two companies.
|
Company |
P / E |
Forward P / E |
P / Cash Flow |
|---|---|---|---|
|
Nike |
21.3 |
20.2 |
17.7 |
|
Adidas |
31.3 |
23.7 |
24.0 |
Data source: Yahoo Finance and Reuters.
Adidas is generally valued at a slight premium to Nike across all three of these metrics. However, it's also important to understand how each company is expected to grow in the years to come in order to make a fully informed decision.
For example, the consensus among sell-side analysts expects Nike to grow its sales 5.9% this year and 6.5% in 2018, whereas Adidas is expected to see its sales rise 13% and 9.3% over this same period. Seen through this lens, Adidas shares should command something of a moderate premium to Nike due to its higher near-term growth rates.
In comparison to the broader market, Nike is somewhat cheaper than the S&P 500's current P/E ratio of 25.9-times earnings. Nike and Adidas offer dividend yields of 1.3% and 1.1% respectively.
Big picture, these two company's share prices probably share more commonalities than differences (Sense a common theme, anyone?). As such, it probably makes the most sense to look beyond near-term, one-off factors and call this segment a tie.
Winner: Tie
And the winner is... Nike by a nose
Nike claims the slightest of edges against Adidas, primarily due to its moderately superior financial position. However, the more important takeaway that investors should focus on is that Nike and Adidas are two world-class companies.
Over the long term, quality stocks tend to do quite well. And as the two clear leaders in the global market for athletic apparel -- though Under Armour also merits consideration -- Nike and Adidas seem like strong bets to continue producing profits for their investors well into the foreseeable future.


