
Wal-Mart (WMT -1.75%) is the biggest retailer on the planet. A ruthless competitive strategy focused on offering the lowest possible prices has yielded a business that generates nearly $500 billion of annual revenue. Its long-term stock returns have been phenomenal, too, as its founding share owners are some of the richest people in the world.
Let's take a look at the main sources of revenue and profits for one of capitalism's greatest success stories.

Image source: Getty Images.
Global but with a U.S. focus
Wal-Mart's business is split into three segments: U.S. retailing, international retailing, and the warehouse division that operates under the Sam's Club brand.
The U.S. unit is by far the largest. It's comprised of 4,600 Wal-Mart stores that spread out 700 million square feet of selling space across the country. The segment generated $308 billion of revenue in the most recent fiscal year to account for 64% of the entire business. For context, Costco (COST 1.01%) is the nation's second-largest retailer, with approximately $84 billion of annual sales.
Next up is the international segment that's worth one-quarter of Wal-Mart's annual sales haul, or $116 billion. This segment has been shrinking as a percentage of total sales for several years, but that's only because of unfavorable foreign currency moves. When adjusted for that shift, the division would have ticked higher by 3% to $127 billion last year as opposed to the 6% decline that the company actually reported.
Finally, Wal-Mart's membership club business accounts for $60 billion of annual sales, or about 12% of the revenue base. The segment is dwarfed by industry leader Costco, whose 512 U.S. locations generate over $80 billion of annual revenue.
Spend money to make money
Wal-Mart is making less money today than in years past. In fact, operating income has decreased for two consecutive years and earnings last year were $13.6 billion, down from $16.2 billion in 2015. Return on investment, a key measure of operating efficiency, also slipped to 15.2% in fiscal 2017 from 15.5% the prior year.
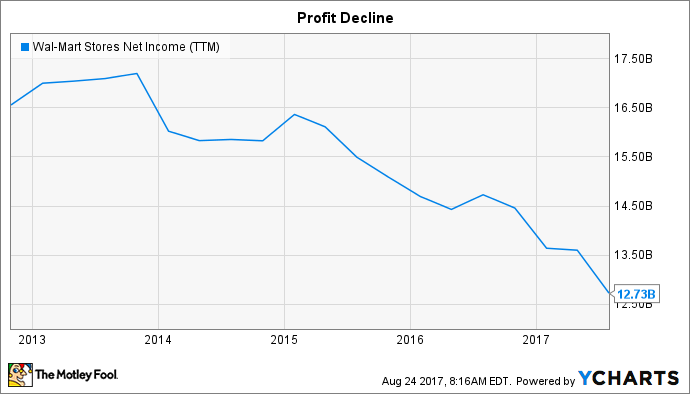
WMT Net Income (TTM) data by YCharts.
Increased spending is the main driver behind that slump. Wal-Mart is directing more cash toward its employees through training, education, and increased wages in the core U.S. market. It has also been shelling out billions of dollars in building up its online infrastructure in response to the long-run shift toward digital shopping.
The moves appear to be paying off for the business. E-commerce sales spiked 60% in the most recent quarter as the company's online inventory ballooned to almost 70 million items, many of which can be delivered to a customer's home in two business days or less. Wal-Mart's physical locations are also enjoying a healthy rebound. Increased customer traffic has helped comparable-store sales improve for 12 consecutive quarters.
Where to from here?
Wal-Mart's growth pace is still modest, and that's partly a consequence of its massive size. Costco is expanding at a 5% rate these days, after all, compared to the retailing king's 2% uptick.
The online sales threat should continue pressuring profits in the coming years, and so shareholders can't count on anything like the booming earnings growth that characterized this business in the past.

WMT Cash from Operations (Annual) data by YCharts.
Yet Wal-Mart remains an attractive investment thanks to its dominant market position, stellar cash flow, and solid dividend yield. These metrics point to decent returns for shareholders of this industry leader despite the likelihood that its market share will shift toward online-focused rivals over time.


