
As an investor, you'll be well served by identifying the major drivers of the businesses in which you invest. That way, you can spend your time following the metrics that matter most, and potentially see important trends before others do.
In this regard, if you're looking to quickly get up to speed on Costco Wholesale's (COST -0.11%) business, the following charts can help you do so.

Image source: Costco Wholesale.
1. Membership growth

Image source: Costco Wholesale.
Roughly 75% of Costco's operating income comes from membership fees, with only about a quarter of the retailer's profits originating from the margin on the goods it sells in its stores. As such, the number of memberships Costco sells is perhaps the most important variable for investors to track.
Over the last decade, Costco has managed to grow total paid members by about 6% annually. To do so, the company focuses intensely on providing value to its members via a powerful combination of high-quality goods, low prices, and a treasure hunt-type shopping experience.
2. Customer retention

Data source: Costco Wholesale financial filings. Chart by author.
This compelling value proposition not only drives new membership growth but also helps to entice existing customers to renew their memberships. Costco excels in this regard, with renewal rates that consistently top 90% in the U.S. and Canada and 88% worldwide.
3. Store count

Data source: Costco Wholesale financial filings. Chart by author.
Costco's membership model has allowed it to open new warehouses at an aggressive rate, even while many other retailers are being forced to shutter stores, as consumer shopping habits increasingly migrate online. In fact, Costco has grown its store count by roughly 4% annually in recent years, with the company now operating 737 warehouses, up from 715 at the end of fiscal 2016.
4. Comps

Data source: Costco Wholesale financial filings. Chart by author.
Moreover, while many retailers are struggling with plunging comparable store sales, Costco's comps have remained solidly in positive territory. It should be noted, however, that Costco's comparable sales growth decelerated to 4% in fiscal 2016, down from the 6% to 7% growth it consistently delivered from fiscal 2012 to 2015. This a trend that bears watching, as it likely will inform investors as to whether the rise of e-commerce -- and Costco's reluctance to invest heavily in its own online operations -- is beginning to exact a larger toll on its business.
5. Regular dividend yield

COST Dividend Yield (TTM) data by YCharts.
Since it began paying a dividend in 2004, Costco has increased its payout on an annual basis. During this time, investors have enjoyed a fivefold increase in the retailer's regular quarterly payout, from an initial dividend of $0.10 in 2004 to $0.50 today.
Yet even after this impressive growth, Costco's stated yield -- which has historically remained in a roughly 1% to 1.5% range -- actually understates its true dividend payouts to investors. That's because the retailer has paid out sizable special dividends on a fairly regular basis.
6. Total dividends paid
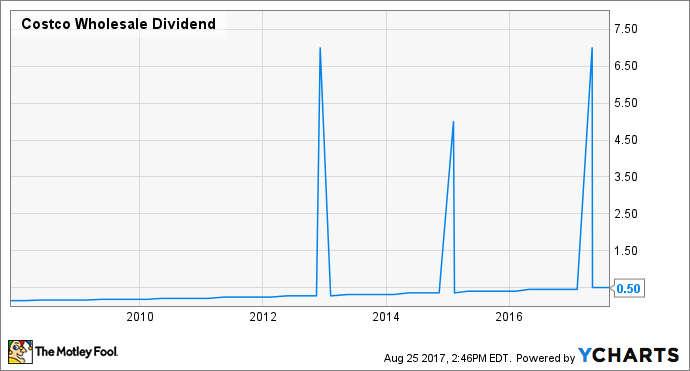
COST Dividend data by YCharts.
Costco began this trend in 2012 when it declared a special $7-per-share dividend. The company followed this up with a $5-per-share special dividend in 2015 and another $7-per-share payout earlier this year.
While shareholders no doubt appreciate these extra payments, many investors would rather see Costco boost its regular payout more aggressively instead of utilizing these large but irregular special dividends. That's because many investors, particularly those near retirement age, rely on dividends for their income needs; predictability is therefore of the utmost importance.
Costco says that the use of special dividends allows it to maintain financial and operational flexibility, which is true. But perhaps the company can meet its shareholders in the middle with a larger regular payment, such as one that sees Costco pay out 40% of its earnings, rather than its historical 30%. This would still allow for further special dividends when it makes sense for the business to do so. Such a compromise would likely be well received by investors.


