Last year, the cryptocurrency market truly gave Wall Street and investors something to marvel at. From the beginning of 2017 to its end, the combined value of all digital currency market caps soared by nearly $600 billion. On a percentage basis, we're talking about an increase in value of more than 3,300% in a single year. No other asset class has ever come close to these scorching single-year returns, and we may never see anything like it again, at least in our lifetime.
Even though bitcoin, the world's largest cryptocurrency by market cap, "underperformed" its peers by gaining 1,364% in 2017, it has vastly outperformed traditional equities since it debuted in 2010. Between March 2010 and mid-December 2017, bitcoin rallied from less than $0.01 to more than $20,000 per token. No stock has even come close to these returns.
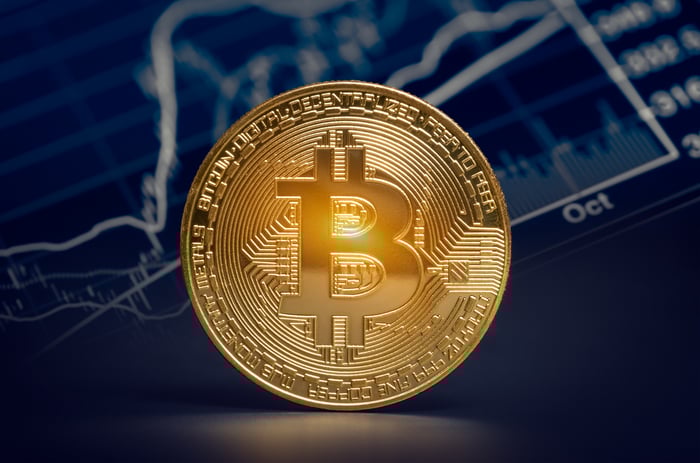
Image source: Getty Images.
How volatile is the world's largest cryptocurrency?
But for as good as bitcoin has been for long-term investors, it has also weighed heavily on their nerves and tried their patience. Despite gaining almost 1,400% last year, bitcoin dipped by at least 30% on five separate occasions in 2017.
What's more, between April 1, 2013, and Jan. 1, 2018, bitcoin underwent 20 corrections that saw its price fall by at least 22%. This included 52% and 59% declines in 2014 and 2015, respectively, as well as the 70% shellacking bitcoin took in 2013. Bitcoin wound up losing more than $8,000 per token at one point this year, shedding more than half of its value between Jan. 1, 2018, and April 6, 2018. That works out to four total corrections of greater than 50% in just five years. By comparison, there have only been three corrections surpassing 50% in the broad-based S&P 500 over the last 90 years!
So, just how much more volatile is bitcoin than traditional investments? For that answer, we'll turn to the Bitcoin Volatility Index, powered by CoinDesk, as well as data provided by the St. Louis Federal Reserve.
The Bitcoin Volatility Index examines the standard deviation of daily returns for a variety of assets, including bitcoin, for the preceding 30- and 60-day windows. In other words, it's a look backwards at historical price activity that allows us to see just how volatile an asset is relative to the U.S. dollar. For example, broad-based stock indexes tend to have a standard deviation of between 0.5% and 1%, while gold has a historical deviation of about 1.2%. In this instance, the lower the percentage, the less volatile an asset is relative to the U.S. dollar.
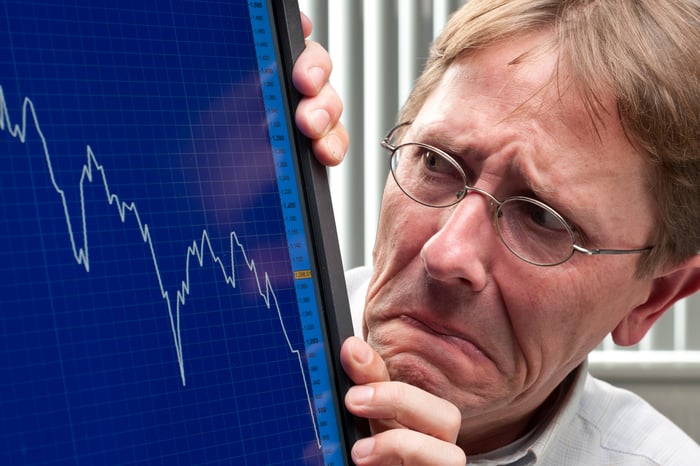
Image source: Getty Images.
What does the Bitcoin Volatility Index say about its namesake? According to the latest 30- and 60-day estimates (as of May 6, 2018) of 4.20% and 4.69%, respectively, it suggests that bitcoin is significantly more volatile than any commodity or traditional equity market. In fact, in April 2013, when bitcoin lost 70% of its value from peak to trough, its standard deviation of daily returns over the trailing-30-day period nearly hit 15%. By comparison, the next-largest deviation for any non-cryptocurrency asset class was gold at 2.83% in August 2011, based on the 30-day estimate -- and even then, gold very quickly came off of these levels.
In other words, bitcoin is many, many times more volatile than traditional assets, and it is certainly not for those with weak stomachs.
Why is bitcoin so volatile?
While there isn't a single answer that sums up why bitcoin vacillates as much as it does, there are four key factors that contribute to its well-above-average volatility.
To begin with, bitcoin has no traditional fundamental metrics that allow investors to come up with an "appropriate valuation." Understandably, an "appropriate valuation" is in the eyes of the beholder for all equity types, including stocks. But at least with a publicly traded company, investors can pore through balance sheets, financial statements, investor presentations, and myriad financial metrics that can assist in their determination of whether a stock is worth investing in. This simply can't be done with bitcoin. Investors can examine its daily transaction volume or transaction processing speed, but that doesn't say a whole lot about bitcoin's ability to survive and thrive over the long term.
Image source: Getty Images.
Second, the decentralization of trading platforms is to blame for bitcoin's volatility. Though decentralization -- the idea of having data stored on computers around the globe, rather than in a central location -- is a core principle of bitcoin and cryptocurrencies as a whole, having bitcoin trade at a different value on each exchange can cause wild swings in its price.
Next, place some of the blame on bitcoin's piecemeal legislation around the globe. There are countries that have banned bitcoin completely, and there are those like Japan that regulate bitcoin like any other form of legal tender. The possibility that regulations surrounding bitcoin and bitcoin trading could change in its key trading markets, such as the U.S. and South Korea, has been known to increase volatility in the world's most popular virtual currency.
Lastly, retail investors are a likely source of volatility. Until recently, Wall Street had kept its nose clean of bitcoin and cryptocurrencies, leaving nearly all trading to be done by retail investors. The issue is that retail investors are considerably more prone to allow their emotions, rather than logic, to dictate their trading activity. In short, retail investors often overshoot to the upside and downside when bitcoin makes a significant price move.
It's possible that bitcoin's volatility could wane in the quarters that lie ahead if institutional investors decide to get involved. However, given the other issues described above, I, for one, wouldn't count on bitcoin's volatility dissipating anytime soon.


