
Before investing your hard-earned dollars into any company, it's important to have a solid understanding of the basics of that company's business.
Although you've probably heard of Apple (AAPL 0.64%) and there's a good chance that you know what the company makes, there are still some business fundamentals that you should probably be aware of before investing in Apple stock. Here are three of them.

Image source: Apple.
The financial basics
In Apple's fiscal 2017, which ended on Sept. 30, 2017, the company brought in more than $229.2 billion in net revenue, which represented an increase of almost $13.6 billion, or 6.3% from the prior year. The company's net income was $48.35 billion, up about 5.8% year over year.
Apple has yet to report its financial results for the fourth quarter of 2018 (and, by extension, its financial results for the entirety of fiscal 2018), but current analyst estimates call for the company to generate about $263.9 billion in revenue and net income of $58.74 billion during that period -- up 15.1% and 21.4%, respectively.
Although the company is set to enjoy significant revenue and profit growth during fiscal 2018 thanks in large part to a surge in the company's large and lucrative iPhone business (iPhone sales made up 61.6% of Apple's fiscal 2017 revenue), analysts expect both metrics to show slower growth in the coming years. Apple's revenue is expected to grow 6.3% in fiscal 2019 and then another 4.2% in fiscal 2020.
Analysts expect the company's net income to grow by nearly 7.3% in fiscal 2019 and then by almost 3.4% in the following year.
Capital return program
Apple generates a substantial amount of free cash flow. Over the past 12 months, it has raked in an eye-popping $58.55 billion -- or $11.52 per share -- of free cash flow.

AAPL Free Cash Flow (TTM) data by YCharts.
Under former Apple CEO Steve Jobs, the company was content to let that cash pile up in the company's coffers. Under current CEO Tim Cook, the company's capital return program has become much more generous.
Apple currently pays a quarterly dividend of $0.73 per share, which works out to $2.92 per share on an annualized basis. The company's dividend yield as of this writing is around 1.3%.
On the company's earnings call in May, CFO Luca Maestri told investors that, "[With] over $13 billion in annual dividend payments, we are proud to be among the largest dividend payers in the world and we continue to plan for annual dividend increases going forward."

AAPL Dividend data by YCharts.
Apple should be able to easily make good on its commitment to annual dividend increases for the foreseeable future, as the company's current annual dividend payment of $2.92 per share is just a fraction of the $11.52 per share in free cash flow that it generated over the past 12 months.
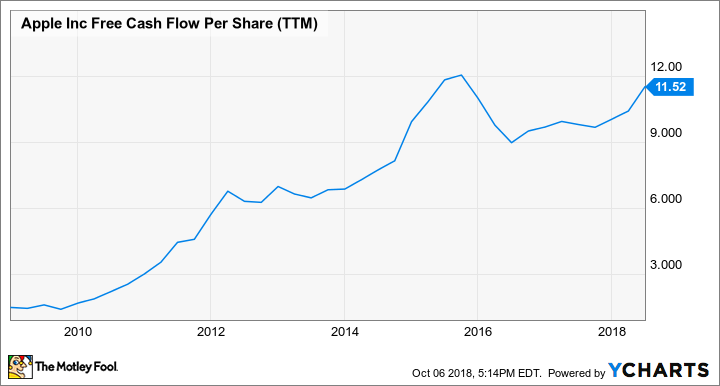
AAPL Free Cash Flow Per Share (TTM) data by YCharts.
Indeed, even if Apple were to struggle to grow its free cash flow per share for a while, the company would still have plenty of room to keep boosting its dividend.
Breaking down the business
It's also important to know just where Apple's revenue comes from. Here's how Apple's reporting segments contributed to revenue in fiscal 2017:
| Segment |
Fiscal 2017 Revenue (in Millions) |
Percentage of Fiscal 2017 Revenue |
|---|---|---|
| iPhone | $141,319 | 61.6% |
| iPad | $19,222 | 8.4% |
| Mac | $25,850 | 11.3% |
| Services | $29,980 | 13.1% |
| All other | $12,863 | 5.6% |
| Total | $229,234 | 100% |
Data source: Apple 10-K filing. Percentages were calculated by author and rounded to nearest tenth.
It's clear from these numbers that during fiscal 2017, Apple's largest business by a landslide was iPhone, followed by services, Mac, iPad, then all other.
Now, let's take a look at this table using the year-to-date numbers that Apple has reported for fiscal 2018 (Apple has reported three out of the four quarters for this year):
| Segment |
YTD Fiscal 2018 Revenue (in Millions) |
Percentage of YTD Fiscal 2018 Revenue |
|---|---|---|
| iPhone | $129,514 | 63.9% |
| iPad | $14,716 | 7.3% |
| Mac | $18,073 | 8.9% |
| Services | $27,209 | 13.4% |
| All other | $13,183 | 6.5% |
| Total | $202,695 | 100% |
Data source: Apple 10-Q filing. Percentages were calculated by author and rounded to the nearest tenth.
Thus far in fiscal 2018, the relative standings of each business group haven't changed from where they were during the entirety of fiscal 2017 -- iPhone is still the biggest business, with services in second, Mac in third, iPad in fourth, and all other in fifth.
We'll get to see what the final percentages for the entirety of fiscal 2018 look like when the company reports its financial results on Nov. 1, 2018.


