
Investors sent lululemon athletica's (LULU 0.85%) stock lower in recent weeks, giving back some of the market-thumping gains it posted through most of 2018. But there's no indication that its retailing business is weakening.
On the contrary, the apparel chain is firing on all cylinders as it wraps up the fiscal year and looks ahead to its broader growth goals of expanding internationally and becoming a force in niches like outerwear and men's fitness.

Image source: Getty Images.
Let's look at a few of the metrics that show just how well the business has been performing lately.
Sales growth
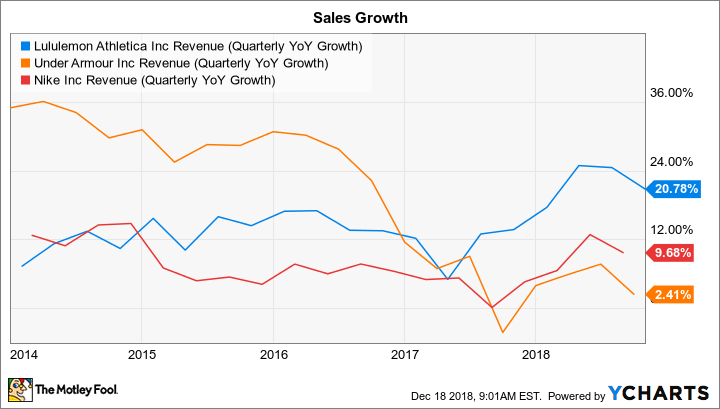
LULU Revenue (Quarterly YoY Growth) data by YCharts.
Revenue jumped 21% last quarter, with help from a 46% spike in online sales and a 7% boost at its physical store locations. Those figures translated into significant market share gains, with peers like Under Armour (UA 1.45%) and Nike (NKE 0.46%) growing overall sales in the single digits in the U.S. geography. The numbers also show how well Lululemon is executing in e-commerce. The company achieved a big improvement in converting shoppers to buyers in that channel last quarter, which pushed it to over 25% of the broader business. Executives had hoped to reach that threshold by 2020, but the company is on pace to blow past that timeline.
Gross margin

LULU Gross Profit Margin (TTM) data by YCharts.
CEO Calvin McDonald and his executive team say that much of the chain's growth lately can be attributed to innovative product launches, and that success is lifting Lululemon's profitability. Gross margin rose by 2 full percentage points last quarter and is approaching the all-time high set back in 2011 when the company was much smaller. Those gains look even better when stacked up against rivals who have struggled with softening gross margin results lately.
The company sees room for further improvement ahead, too, with merchandise margins set to rise in the fourth quarter and over the next few years thanks to apparel releases and falling supply chain costs.
Operating income
Lululemon may be focused on winning market share growth right now, but the company isn't sacrificing bottom-line profitability to achieve that goal. Sure, management is spending aggressively today to strengthen the online selling infrastructure and invest in areas like marketing and research and development. These long-term growth priorities will sound familiar to shareholders of Nike and Under Armour, which have each told investors that such costs will keep a lid on short-term earnings gains.
Lululemon hasn't had to issue a similar warning. Instead, expenses have declined as a percentage of sales to 36.5% through the first nine months of the year from 37.2% in the year-ago period. Combine that favorable trend with the 2-percentage-point boost in gross profit margin and you get a fundamentally stronger earning position. Lululemon's operating margin has jumped to 18% of sales from 12% last year. Peers are faring much worse in this regard.

LULU Operating Income (TTM) data by YCharts.
Given these successes, it's no surprise that Lululemon's management team is sounding so bullish about its growth opportunities. Annual sales are set to pass $3.2 billion in 2018 to put the company in a great position to reach its goal of $4 billion by 2020.
Investors can look forward to that figure marching higher as the chain adds international markets and moves to push men's apparel beyond its current mark at about 25% of the business. If recent history is any guide, there's a good chance that Lululemon can attack those attractive growth areas while improving its earnings power in 2019.


