
So you want to build a retirement portfolio with a smattering of dividend aristocrats -- companies that have raised their dividends for more than 25 consecutive year -- but don't know where to start? The following article is intended to help investors do just that, while providing a methodology from which investors can take away and apply to their investing elsewhere.

Dividend aristocrats should give you income while you wait for capital growth. Image source: Getty Images.
The three best dividend aristocrats
I'll cut to the chase. The three picks are coatings company PPG Industries, food product company Hormel Foods and construction, resources, energy and transportation machinery company, Caterpillar.
All three have a track record of dividend payments, and trade on favorable valuations with good initial yields and strong potential for good long-term growth. In addition, they all have relatively little risk to earnings growth in the future and a solid market position.
With these sort of conditions in mind I analyzed all 57 dividend aristocrats and used a dividend discount model to value them followed by a qualitative assessment of the risk to their long-term earnings and dividend potential.
The Gordon Growth Model
Skip this section if you are familiar with dividend discount models, and/or just want to jump to the stock discussion.
In order to ascertain whether a company can grow its dividend in the future you will need to know and assume a few things about it, specifically how much of its current earnings its paying in dividends, known as the payout ratio and an estimate for its return on equity (RoE). The RoE is defined as net income/shareholder equity and can be taken as a measure for much money a company generates from what's been invested in it.
Using the Gordon Growth Model in order to calculate the rate at which a company can grow its dividend (g) produces the following equation:
- g=RoE*(1-dps/eps)
- g: rate at which a company can theoretically grow its dividend
- RoE: return on equity
- dps: dividend per share
- eps: earnings per share
The equation will calculate the theoretical growth rate, but now you need a way to check the valuation of the stock before you buy it -- after all there's no point buying a stock that can grow its dividend strongly if it trades on a tiny yield to start with.

It makes sense to spend a little time on some simple calculations in order to make investment decisions that could last a lifetime. Image source: Getty Images.
Assuming that a stock's value is the sum of all its future dividends means that you can ascertain a valuation for a stock if you know (g) and the rate of return you want for the stock. Again, using a dividend discount model, it follows that:
- P=dps/r-g
- P: stock price
- r: cost of capital, or theoretical rate of return
Rearranging the equation creates the following equation
- r=(dps/P)+ g
In other words, simply add the stock's current dividend yield (dps/P) to its theoretical growth rate (g) and you will get the theoretical rate of yearly return on the stock. So for example, one of the stocks rejected from the short list, namely medical device maker Medtronic trades at $110 has a current dividend yield of 2% and a theoretical dividend growth rate (g) of 8.64% so it can return you (r) 10.64% every year -- at least in theory!
The top 25 dividend aristocrats
Let's get straight to the final shortlist.
In case you are wondering, the RoE figures used were the lower of the 10 year mean or median average. Here's a table of the final 25 stocks selected with the key metrics on show. As you can see below, purely based on the theoretical rate of return metrics United Technologies is the best value of the final 25, with Medtronic bring up the rear.
Aside from the three picks, the author would suggest a second tier of stocks like Ecolab, United Technologies, McCormick, Johnson & Johnson and V.F. Corp are worth a close look. As you can see below, probably the primary thing to look for is margin trend.
I'm going to leave the list here for investors to take a close look at.
| Company | Return on Equity, RoE | Theoretical growth rate, g | Dividend Yield | Theoretical rate of return | Reason not picked |
|---|---|---|---|---|---|
| United Technologies (RTX 0.19%) | 13.26% | 19.67% | 2% | 21.7% | Company is breaking up |
| W.W. Grainger (GWW -2.33%) | 26.55% | 17.79% | 1.8% | 19.6% | Potential margin challenges in the industrial supply industry from Amazon.com (AMZN -2.81%) |
| PPG Industries (PPG -1.05%) | 26.47% | 17.83% | 1.6% | 19.5% | Pick |
| T. Rowe Price (TROW -2.68%) | 24.26% | 14.88% | 2.5% | 17.4% | Regulatory risk and subject to market conditions |
| Lowe's Companies (LOW -1.77%) | 25.19% | 15.42% | 1.9% | 17.3% | Online competition could threaten margin |
| Sysco Corp (SYY -0.66%) | 26.46% | 13.96% | 2.3% | 16.2% | Wafer thin margin |
| General Dynamics (GD 0.51%) | 20.12% | 13.23% | 2.2% | 15.5% | Political risk, defense spending priorities |
| McCormick (MKC -0.58%) | 24.35% | 13.97% | 1.4% | 15.3% | Strong candidate, but potential competition from instore brands |
| Caterpillar (CAT -7.01%) | 20.03% | 12.42% | 2.9% | 15.3% | Pick |
| Aflac (AFL -1.07%) | 17.51% | 13.24% | 2% | 15.2% | Political risk |
| Linde (LIN -0.52%) | 26.33% | 13.55% | 1.7% | 15.2% | Fossil fuel exposure |
| Becton Dickinson (BDX -1.11%) | 17.82% | 13.45% | 1.2% | 14.7% | Declining margin trend |
| Franklin Resources (BEN -1.68%) | 17.72% | 10.46% | 3.8% | 14.3% | Declining margin trend |
|
Dover Corp (DOV 4.72%) |
18.17% | 12.08% | 1.8% | 13.9% | Company has been significantly restructured |
| Johnson & Johnson (JNJ -1.28%) | 19.55% | 10.98% | 2.8% | 13.8% | Strong candidate, missed the cut due to political risk |
| Walgreens Boots Alliance (WBA -0.81%) | 14.67% | 10.14% | 3% | 13.2% | Political risk from potential action on pharmaceutical pricing |
| Walmart (WMT 0.13%) | 19.53% | 11.25% | 1.8% | 13% | Declining margin trend, potential online competition |
| Ecolab (ECL -1.07%) | 17.12% | 11.74% | 1% | 12.7% | Narrowly missed selection, a worthy contender |
| A. O. Smith (AOS -6.05%) | 18.39% | 10.58% | 2% | 12.6% | Over reliance on emerging markets for growth |
| Genuine Parts Company (GPC -1.27%) | 20.53% | 9.45% | 3% | 12.4% | Declining margin trend, declining asset turnover |
| Target Corp (TGT -0.86%) | 17.99% | 10.30% | 2.1% | 12.4% | Declining margin trend, potential online competition |
| Cardinal Health (CAH 0.40%) | 13.24% | 8.20% | 3.5% | 11.7% | Wafer thin margin |
| VF Corp (VFC -4.62%) | 21.11% | 9.08% | 2.3% | 11.3% | Strong candidate, missed due to declining margin trends and potential online competition |
| Hormel Foods (HRL -0.93%) | 17.90% | 9.21% | 2% | 11.2% | Pick |
| Medtronic (MDT -1.83%) | 14.06% | 8.64% | 2% | 10.6% | Declining margin trend |
Data source: Company presentations. Author's analysis
The statistics aren't enough
The immediate question many investors will be asking is why not just pick the top five from the list above?
Put simply, if you are going to buy and hold a dividend stock for the next 20 to 30 years the you better ty to make sure they have a good chance of continuing to generate the kind of RoE that they generated in order to make it onto the list in the first place.
While this approach includes the kind of qualitative risk assessment that appears to go against the grain of the dividend discount model, the reality is that every mechanical based strategy ultimately results in an unintentional style or sector bias anyway -- you will end up taking a view whether you like or not.
Hormel Foods for its balance sheet, end markets and brand strength
Despite having one of the lowest theoretical rate of return figures in the last 25 the food products company makes the final three thanks to a combination of excellent trends in its RoE, its relatively safe earning prospects and the fact that management runs the business relatively conservatively. You could think of Hormel Foods as a kind of rock solid dividend, but unexciting, dividend aristocrat option -- probably what you are looking for if you are committing money over the long-term.
Founded in 1891 the company's best known product is probably SPAM -- it's not clear if Margaret Thatcher's predilection for the product during World War II influenced her positive approach to UK/US relations, but I'd like to think so -- , but Hormel also owns a plethora of grocery and refrigerated food brands. Among its brands include such staples of the American kitchen as Skippy peanut butter, Dinty Moore beef stew, Mary Kitchen hash, bacon, pepperoni, chicken and turkey food products.
Ownership and end markets
Hormel is 48% owned by the Hormel Foundation -- an organization whose goals are clearly laid out and understood by the food company's management. Specifically, the Hormel Foundation intends to preserve the independence of the company, support its local community in Austin (Minnesota) and "provide for the financial welfare of family heirs."

Image source: Getty Images
The last point probably goes a long way to explaining the conservatism of the company, and if you buy the stock you will be sharing the aims of the descendants of the original owners of the company and the 20,000 employees who received stock options in 2018.
Slightly more than half of its sales come from the U.S. retail market, 31% from U.S. foodservice, 10% from U.S. deli and only 7% from international markets. In a nutshell, Hormel tends to play in markets it understands well.
Pork products are responsible for around 52% of sales, with turkey contributing 20%, and beef 9% with chicken and others contributing 3% and around 16% coming from non-meat products. Whichever way you look at it, Hormel Foods is a play on U.S. consumer demand for protein.
As such, the company targets 2%-3% organic sales growth over the long-term leading to 5%-7% annual organic operating profit growth. Throw in some acquisitions and those figures jump to 5% and 10%.
Return on equity, margin expansion and low debt
Digging into the components of RoE it's clear that Hormel has some very nice trends behind it. Apologies for reintroducing some first grade algebra here, but it's time to return to RoE or how he company makes money from shareholder equity.
It can be shown that RoE can be calculated by multiplying the three factors outlined below. You can take a moment to check the equation -- it should be clear that assets (from asset turnover and financial leverage) and revenue (from net income margin and asset turnover) cancel each other out leaving RoE, or net income/shareholder equity.
- Return on equity = net income margin*asset turnover*financial leverage
- Return on equity: net income/shareholder equity
- Net income margin: net income/revenue
- Asset turnover: revenue/assets
- Financial leverage: assets/shareholder equity
A higher net income margin and a higher asset turnover are good -- the company is becoming more profitable and generating more revenue from its assets. However, higher financial leverage can be a sign of a company taking on debt in order to try and boost RoE.
As you can see below, that's definitely the case with Hormel Foods -- further evidence of its conservative management style. In fact, margin is on a nice uptrend, even though asset turnover has been a bit weaker in recent years. However, debt to equity levels are very low -- Hormel's balance sheet is rock solid.

Data source: Hormel Foods presentations. Author's analysis.
Hormel's investments for growth
Hormel is a conservatively run company, but that doesn't mean it's not investing for growth -- a key point as food product companies need to constantly develop new products and brands in order to respond to changing consumer tastes. Here again, the company scores well. For example, here's a look at its capital expenditures compared to depreciation & amortization -- you would want the former to exceed the latter as it implies the company isn't just maintaining its assets, it's also investing for growth.
As you can see in the chart below, Hormel investing for growth -- and a rate that compares favorably to its peer group.
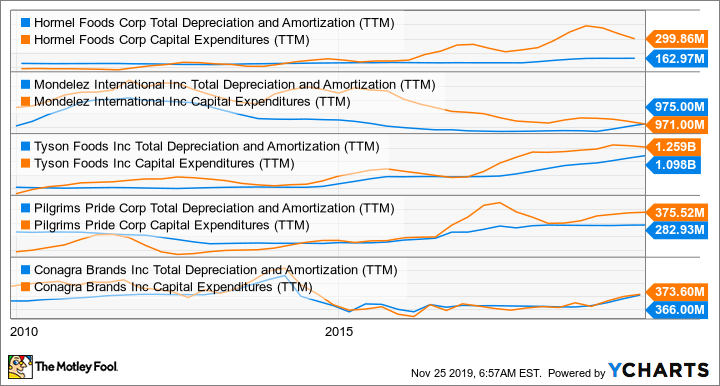
HRL Total Depreciation and Amortization (TTM) data by YCharts
Hormel Foods is a buy
Putting it all together, Hormel is a well-run company with good earnings momentum in a relatively safe industry. Management continues to invest for growth, without leveraging up on debt, and provided you believe that its protein food products (particularly pork) have a future in the American kitchen then the stock is a solid addition to a retirement portfolio.
The investment case for PPG Industries
As you can see in the first table above, PPG's high RoE is the basis on which the investment case is being made. In that case, here's a repeat of the exercise carried out with Hormel Foods above.
A quick look shows that there's been a nice upward drift in margin in the decade since the last recession. The net income margin figures are definitely artificially boosted by the short term impact of the acquisition of AkzoNobel's North American architectural coatings business in 2013 and then the Mexico based architectural coatings company Comex in 2014.
However, the underlying trend in margin remains positive and the acquisitions haven't significantly increased financial leverage or debt to equity levels. Meanwhile, PPG continues to generate a consistent amount of revenue from assets (asset turnover). In short, the acquisitions appear to have increased margin and revenue without negatively impacting its underlying operating performance on debt levels -- good news, but can it continue?

Data source: PPG Industries presentations.
The answer to the question lies in appreciating PPG's business and its prospects going forward.
How PPG Industries makes money
The coatings industry comprises of four main end markets. Architectural (new build and maintenance) and general industrial are the largest two, followed by automotive original equipment manufacturer (OEM) and automotive aftermarket and then smaller markets such as aerospace, marine & packaging.
In general, you can think of PPG as being a company with a slight over exposure to architectural/construction coatings and a significant over-exposure to aerospace, and the automotive OEM and refinish market. However, it's significantly under exposed to general industrial coatings and protective & marine). In a nutshell, the architectural/construction and automotive (OEM and refinish) are the key swing factors in is growth prospects.

Data source: PPG Industries presentation.
PPG Industries end market prospect prospects
The company's long-term revenue and earnings prospects look good. While, it's true that new construction and automotive OEM production are cyclical activities, the global long-term trend remains positive and it's worth noting that the overwhelming majority of demand comes from maintaining architectural buildings (at least 75%) and automotive refinish -- far less cyclical revenue.
Moreover, the paint & coatings industry is a highly fragmented industry an era of consolidation with Sherwin Williams (SHW -0.50%) -- a company that narrowly missed inclusion on the shortlist due to its small dividend yield of 0.8% -- buying Valspar in 2017, and Axalta (AXTA -1.38%) openly pursuing strategic options including a potential sale -- PPG is reportedly interested. As PPG's margin performance attests, consolidation and the building of scale in a market usually leads to an improvement in margin across the board.
As you can see below, PPG's margins already comparable favorably with its peer group.

PPG Gross Profit Margin (TTM) data by YCharts
Is PPG a buy
The company is the number one or two global player in the architecture, automotive and aerospace markets and number three in general industrial. If you believe that the global economy will grow, then you believe in the future of the paint and coatings industry. Meanwhile, the industry is consolidating, implying that margin and RoE can improve going forward.
All told, PPG is a good option for long-term divided focused investors.
Caterpillar is the surprise pick
There's no two ways around it. Caterpillar is a highly cyclical stock and, as such, its revenue and earnings are going fluctuate with the ups and downs of the economy and its specific end markets. The same applies for its RoE and specifically its profit margin and asset turnover.
That said the results over the last decade are useful to look at because they contain a significant period of weakness -- specifically the 2014-2016 period when commodity prices collapsed -- not good news for Caterpillar's resource industries and oil & gas equipment sales. Similarly, the company is going through a difficult period in 2019 as well and analysts have sales declining by low single digits in 2019 & 2020.

Data source: Caterpillar presentations.
The investment case for Caterpillar
There's no shortage of downside risk in the near-term with Caterpillar, but here's the thing, there's also plenty of upside risk in the long-term too. Moreover, the company's ability to leverage a pickup in end markets, and revenue, into margin expansion and RoE stands it in good stead. You can't just value a cyclical stock at a low point, in the same way that it doesn't make sense to use its peak earnings and RoE as a base.
In addition, Caterpillar's CFO Jim Umpley has already committed the company to increasing the dividend by a high-single-digit percentage every year for the next four years, and he estimates the dividend will consume no more than 50%-60% of the company's free cash flow at the next trough in earnings and cash flow.
Umpleby's free cash flow projections call for $4 billion to $8 billion over the cycle, a figure which would easily cover the current divided payment of some $2 billion.
Is Caterpillar to buy?
To be clear, if you aren't confident in ongoing growth in the economy and/or the growth of construction spending in China -- it's not just about construction equipment, the country drives global demand for metals & mining commodities and therefore capital spending on mining machinery -- , then Caterpillar is one to avoid.
However, if you believe the global economy will continue to grow and Caterpillar will continue to be a leading player in heavy equipment -- likely given the huge capital outlays necessary to enter the market -- then the stock is set to reward income seeking investors for years to come.
Three dividend aristocrat stocks to buy
All told, Hormel offers a rock solid balance sheet, a useful 2% dividend yield and relatively defensive end market exposure. PPG Industries has more cyclical stock risk, but it's a leading player in an integral part of the economy and an industry that's set for more consolidation -- suggesting margins could rise in the future.
Caterpillar as a dividend pick might surprise many, but investors shouldn't be afraid of buying highly cyclical stocks, particularly if they command the kind of industry leadership that Caterpillar does. The company's RoE over the cycle is excellent, and it has a near 3% dividend yield which is set to grow and generate income for investors for many years to come.


