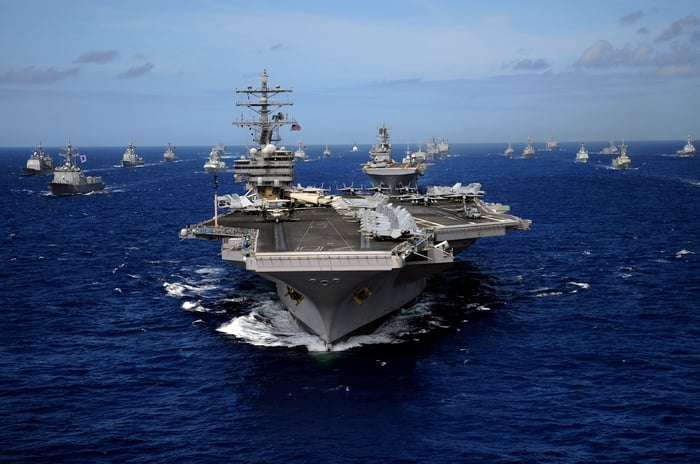
Shares of Huntington Ingalls (HII 1.05%), the military shipbuilder responsible for building about half the U.S. submarine fleet and all of its aircraft carriers, tumbled 4% after the company reported Q4 2021 earnings Thursday morning, only to defy a savage market sell-off and rise again on Friday.
But which investors were right -- the ones who sold Huntington Ingalls stock on Thursday, or those who bought it back on Friday?

Image source: Getty Images.
The numbers
Huntington Ingalls reported generating $2.7 billion in Q4 2021 revenue on Thursday, and $9.5 billion for the full year of 2021. Revenue was down 3% year-over-year for the quarter, but up 2% for the full fiscal year.
Operating profit margins on that revenue slumped in the year's final quarter, falling to just 4.5%, versus 5.4% for the year as a whole. To put that in context, S&P Global Market Intelligence data confirm that single-digit profit margins are the historical norm for Huntington Ingalls -- but 5.4% is roughly half what the company was earning just six years ago.
By the time profits had reached the bottom line, Huntington had earned just $2.99 per share for the quarter, down more than half from last year's Q4, and just $13.50 per share for the year, down 21% year-over-year. And free cash flow slumped similarly, falling 41% year-over-year to just $449 million generated through the end of 2021.
Speaking of free cash flow
Let's talk a little more about that free cash flow. 2020 was an exceptionally profitable year for Huntington Ingalls from a cash-generation standpoint, with $740 million in FCF produced. It was also, however, a bit above average. Over the five year period from 2016 through 2020, Huntington Ingalls actually averaged closer to $505 million per year in FCF -- and Huntington Ingalls' latest guidance suggests that FCF at the company will continue to look lumpy going forward.
Consider: Giving guidance for the future, Huntington Ingalls advised that it expects to generate "FY20-FY24 free cash flow of approximately $3.2 billion." That works out to a nice, round $640 million on average over the five-year period. But the company reported $740 million generated in 2020 and $449 million generated in 2021, and says 2022 FCF will range from $300 million to $350 million.
This means that management is expecting FCF to slump even further in 2022. To reach $3.2 billion for the whole period, however, FCF must rebound to as much as $855 million in cash generated each year in 2023 and 2024.
So is Huntington Ingalls a "buy"?
That big jump in cash production in 2023 and 2024 is going to look really impressive when it happens (if it happens), and could very well attract buyers to the stock. In the meantime, long-term investors might want to value the company more on its long-term average numbers, which is to say the $640 million average annual free cash flow.
How do we do that?
Begin with the company's market capitalization: $7.4 billion. Add debt net of cash -- about $2.9 billion -- and you arrive at an enterprise value of $10.3 billion for Huntington Ingalls stock. Divided by $640 million in free cash flow and this gives us an enterprise value-to-free cash flow ratio of about 16 for the stock, which pays its shareholders a 2.6% dividend yield -- and which is estimated, by analysts, to be growing earnings at about 16% annually over the next five years.
By my calculations, that all works out to a total return ratio of about 0.9 for Huntington Ingalls stock. Given that anything under a 1.0x total return is generally considered "cheap" by value investors, I conclude that Huntington Ingalls looks like a moderately cheap stock, and worth at least a nibble in this still-overpriced stock market.
That being said, as free cash flow continues to slump into 2022, the stock could very well get even cheaper later this year. My best advice, therefore, is to consider waiting to buy more aggressively should Huntington Ingalls stock drop over the coming quarters.


