It's been an ugly start to the new year for Wall Street and investors. Following what's effectively been the strongest bounce from a bear market bottom in history, all three major U.S. indexes have entered correction territory.
Earlier in the week, the iconic Dow Jones Industrial Average (^DJI 0.06%) and benchmark S&P 500 (^GSPC -0.22%) were more than 10% below their all-time closing highs. That's the official cutoff for a major index to enter "correction territory."
As for the growth-centric Nasdaq Composite (^IXIC -0.52%), things were even worse. At one point this past week, the Nasdaq was 22% below its November closing high. That put the index in a bear market.
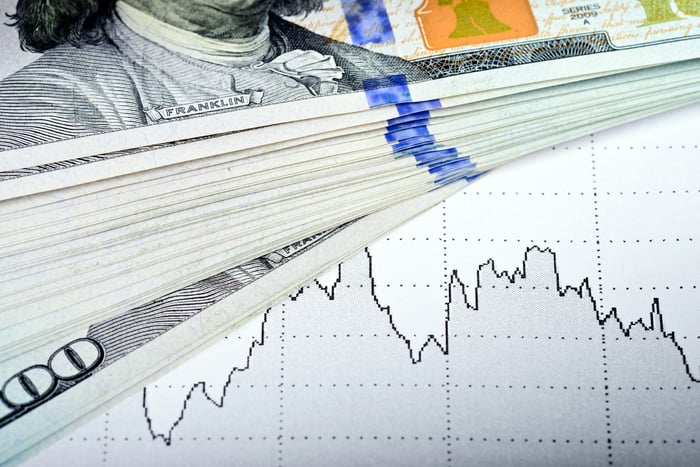
Image source: Getty Images.
How long do market corrections typically last?
When volatility picks up, the natural question on the minds of investors is, "When will it end?" While there's no definitive answer to this question, there's quite a bit of historical data that can offer clues.
Market-analytics firm Yardeni Research has published an abundance of data on all of the S&P 500's corrections dating back multiple decades. This includes the peak-to-trough declines for all corrections dating back to the Great Depression (1929), as well as how many calendar days it took for these declines to find their bottoms.
Since the beginning of 1950, there have been 39 official corrections in the S&P 500. Below, you can see how long it took for each to resolve (save for the ongoing correction), as well as how steep the ultimate decline was on a peak-to-trough basis.

Correction length listed in calendar days. Red represents corrections lasting longer than a year, yellow between 157 and 288 days, and green 104 or fewer days. Data source: Yardeni Research. Table by Author.
The average stock market correction takes six months to find a bottom
Since we're a fifth of the way through 2022 (75 days), it means there have been 39 corrections over 72.2 years. There's an average of one double-digit decline in the S&P 500 every 1.85 years. Even though the market doesn't follow averages, it's a good reminder of just how common lower market moves are.
What's particularly noteworthy is the length of most corrections. As you'll note from the color coding above, only seven of the previous 38 corrections (we don't know precisely how long the current correction will last) since the beginning of 1950 have taken more than a year to find their bottoms. Comparatively, 24 of these 38 double-digit declines found their troughs in 104 or fewer calendar days (about 3.5 months).
As a whole, the S&P 500 spent 7,168 days correcting from peak to trough in the 72 years from Jan. 1, 1950 to Dec. 31, 2021. This works out to an average correction length of 188.6 days, or about six months.

Image source: Getty Images.
Modern-day market corrections are about a month shorter
However, there's a bit of a caveat to the data above.
Perceptive eyes will note that corrections tended to last a lot longer prior to 1987. Between 1950 and 1986, there were five declines that took more than a year to find a bottom, as well as six corrections ranging from five to 10 months. In the 35 years since then -- what I'd refer to as the "modern-era market" -- there have been only three corrections that took longer than 104 calendar days to resolve.
What changed, you ask? I'd point to the digitization of Wall Street. Bringing computers to the trading floor and steadily democratizing the spread of information from Wall Street to Main Street reduced stock market uncertainty and led to faster-resolving corrections.
Since 1987, modern-day corrections have resolved in an average of 155.4 calendar days (about five months). That's just over a month faster than the average peak-to-trough correction length dating back to the beginning of 1950.
Furthermore, if you remove the dot-com bubble and financial crisis, the typical correction since 1987 has resolved in an average of just 74.3 calendar days (about 2.5 months). For context, the ongoing correction in the S&P 500 is at 64 calendar days, as of March 16.

Image source: Getty Images.
Fortune favors the patient
But the biggest takeaway of all from this data is that patience pays off handsomely on Wall Street. Even after lengthy corrections, bull market rallies in the Dow Jones, Nasdaq Composite, and S&P 500 eventually put their respective corrections in the rearview mirror.
One of the more intriguing annual data releases on the power of long-term investing comes from Crestmont Research. Crestmont examined the rolling 20-year average annual total returns, including dividends, for 103 end years between 1919 and 2021 for the S&P 500. As an example, 1964 as the end year would average the S&P 500's annual total return for 1945 through 1964 (20 years).
The result? The S&P 500 has always made money for investors on a total-return basis if they held for at least 20 years. Interestingly, more than 40 of the end years examined produced an average annual total return ranging between 10.8% and 17.1%. On the other end of the spectrum, there were only two end years (1948 and 1949) out of 103 where the average annual total return was less than 5%.
Wall Street is a wealth-building machine if you give it time and trust your investing theses. In other words, now is as good a time as any to put your money to work on Wall Street.


