This article was updated on April 17, 2018, and originally published on July 8, 2014.
Stock prices constantly fluctuate -- sometimes rapidly -- and understanding how to gauge the overall health of the stock market in the midst headline-grabbing swings is key to being a good investor.
Three key market indices can help you quickly assess how the market is performing: The Dow Jones Industrial Average (^DJI -0.98%), the Nasdaq (^IXIC -0.64%), and the S&P 500 (^GSPC -0.46%). But how should investors interpret movements in these indices?
To better understand the mechanics of the market, let's break down each of these major indices and drill down into why each is different and also somewhat the same.

IMAGE SOURCE: GETTY IMAGES
The Dow Jones
The Dow Jones Industrial Average is the oldest, best known, and most followed of the major stock market indices. It is comprised solely of 30 large-cap companies. These companies represent a huge array of American business -- from consumer-facing to business-to-business, tech to manufacturing, domestic to international, and everything in between.
Two concepts make the Dow so popular. First, the companies in the index are huge, and taken together they legitimately represent a huge swath of the U.S. economy. So while there are thousands of publicly traded companies, these big boys are sufficiently large to effectively act as a proxy for all the other enterprises.

Second, the Dow components are nearly universally recognized household names. With the likes of Coca Cola (KO 0.31%), McDonald's, or IBM, investors know that these companies are the real deal, with the size, scale, and presence in the economy to accurately stand as a proxy for the overall markets.
The Dow does have a quirk, a remnant of its history of more than a century. The index is price-weighted, meaning that companies with a higher share price have a larger impact on the Dow's movements.
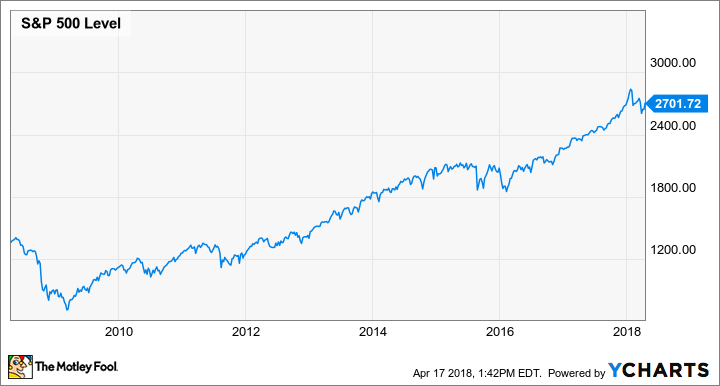
The S&P 500 takes a slightly different approach to represent the movements of the broader markets. The index covers the largest companies that trade on the New York Stock Exchange or Nasdaq Stock Market, weighted by market cap.
The S&P 500 chooses component companies based on a few basic criteria. The stock must trade at sufficient volume with adequate market liquidity. The company's market cap must be above $5 billion. At least 50% of the company's stock must be part of the public float.
The S&P also attempts to mirror the diversity of the largest companies on the NYSE and Nasdaq; if 10% of the largest companies are in manufacturing, then the S&P will attempt to maintain 10% of the index in manufacturing companies.
There are two other obvious yet notable contrasts with the Dow. First, there's the number of component stocks, 30 versus 500. The S&P is a much broader measure of the markets and captures a greater percentage of the U.S. economy. That said, the lower you move in market cap, the less impact those stocks have on the index as a whole. So in many instances, the Dow and the S&P track each other very closely.
Second, unlike the Dow, the S&P is not price-weighted. Instead, it weights its component companies by the actual size of the company in the market. This eliminates some of the odd Dow pricing when a stock with a high stock price but relatively lower market cap makes a large movement in either direction.
Both of these differences creates a smoothing effect on the S&P -- it's just not as volatile as the Dow.
The Nasdaq
First, let's clarify exactly what we're talking about here. The Nasdaq (NDAQ -1.97%) is a stock exchange, similar to the New York Stock Exchange. It was, in fact, the first all-electronic stock exchange. That is not what we're here to discuss.
We're talking about the Nasdaq Composite, another market proxy based on certain stocks being publicly traded. The Nasdaq Composite is based on the 4,000+ stocks being traded on the Nasdaq Stock Market. The difference is subtle, but it's worth understanding to avoid any confusion.
Generally, the Nasdaq Composite is a good proxy for what is happening in the tech segments of the markets. The vast majority of the companies trading on the exchange are tech, which leads to this generalization.

That said, there are certainly a respectable number of companies from a broad range of industries also traded on the Nasdaq Composite but these non-tech components remain a small contingent in this index.
Like the S&P, the Nasdaq is weighted by market cap, thus avoiding some of the odd pricing situations seen with the Dow.
So which way is the market heading?
When I see the headlines at the end of the day's trading, I tend to gravitate to the S&P 500. To me, the 500 component stocks weighted by market cap is the best representation of the broad market movements.
If you're interested in tech, then you may have more interest in the Nasdaq. Just know that you're not looking at the market in a broad sense with that index, you're looking disproportionately at the tech segment.
The Dow, of course, is and will remain the primary index used in the news and by most public market commentators. It's the oldest, it's the best known, and in truth it's good enough to serve in that role. But, as a Foolish investor, always keep in the back of your mind that it has just 30 stocks and it's calculated with that oddball price-weighted system.


