Inflation is the change in prices over a period of time. A 1% inflation rate implies that an item that cost $100 last year would cost $101 this year. Of course, inflation doesn't affect every type of purchase in the same way, and there is quite a bit more to inflation than the basic idea of things getting more expensive over time. In this article, we'll take a look at what inflation is, what causes it, how it is calculated, and what it means to investors.
What is inflation?
What is inflation?
In the financial sense of the word, inflation refers to an increase in prices over time. Rising prices over time lead to a decline in the purchasing power of money. If lunch at your favorite sandwich shop cost $10 last year and prices inflated by 10% this year, you can expect your lunch to now cost $11. You'll need 10% more money to buy it. In other words, if you had kept $10 in cash, it is now worth less. It used to be enough to buy lunch, but it isn't now.
Inflation depends on a bunch of economic factors, and there are several ways to calculate it. The most common measure of U.S. inflation is the Department of Labor's Consumer Price Index (CPI), which uses a representative basket of goods and services to determine trends in prices over time.
We'll take a closer look at the CPI and other common ways inflation is measured later. For now, the key point is that inflation is a comparison of the current purchasing power of money with the purchasing power of the same amount of money at some point in the past.
As a general rule, when the economy is healthy, a moderate (low single-digit) inflation rate is to be expected. It may sound counterintuitive, but some inflation is actually good for the economy. Most economists agree that a mild level of inflation is helpful for economic growth. Part of the Federal Reserve Board's mandate is to keep inflation under control, and the central bank currently targets a 2% long-term inflation rate.
It's entirely possible to have negative inflation with prices falling over time. This is known as deflation, and it is often seen in tough economic times. Deflation tends to be harmful to economic growth, and governments try to avoid it.
Sometimes inflation can be a little misleading if the price of a certain item either skyrockets or collapses. For example, if gasoline prices drop by 50%, it can make the inflation rate look lower than it actually is because the price of one widely used commodity is costing significantly less.
Historical inflation rates
Historical inflation rates
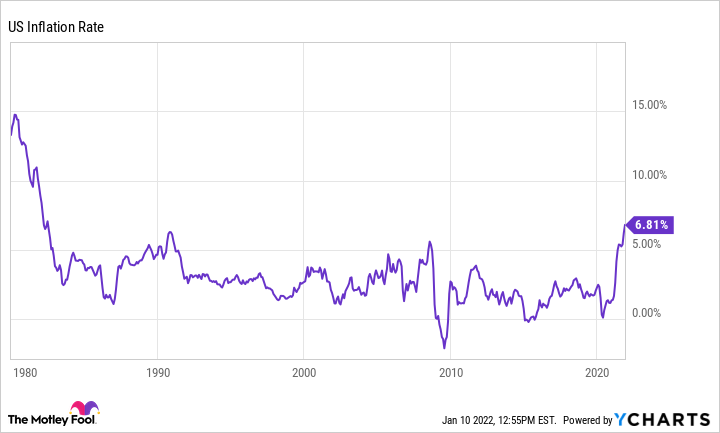
Over the past 100 years, the inflation rate in the U.S. has averaged 3.22% per year, but the amount has varied widely. At one extreme, the inflation rate was as high as 18% in 1910, and it has reached double digits again eight times since then. On the other end of the spectrum, we have experienced negative inflation rates, particularly in the wake of the Great Depression and the 2008-09 financial crisis.
Inflation in the 1970s
Inflation was rather elevated throughout the 1970s, with full-year inflation at 3.2% or greater every year of that decade and reaching 11% or more in 1974 and 1979.
Inflation in the 1980s
The worst inflation in recent U.S. history occurred in the late 1970s and early 1980s, mainly caused by a global disruption in oil supplies. The inflation rate hit 11.3% in 1979, increased to 13.5% in 1980, and remained above 10% in 1981. The Fed took aggressive interest rate actions to finally get inflation under control.
Inflation in the 1990s
The 1990s were a relatively tame decade for inflation, with full-year inflation rates ranging from 5.4% in 1990 to 1.6% in 1998. For the most part, inflation stayed between 2% and 4% throughout the decade.
Inflation in the 2000s
The 2000s saw the first deflation in decades, with a negative 0.4% inflation rate in 2008 caused by the financial crisis that sent shockwaves throughout the economy. Excluding the crisis, however, inflation ranged from a low of 1.6% to a high of 3.8%.
Inflation in the 2010s
The 2010s were another decade of relatively tame inflation, with full-year inflation rates ranging from 0.1% in 2015 to 3.2% in 2011. For the most part, this was a strong decade of economic growth, and there were few inflation-driving catalysts.
Inflation now
After several decades of tame inflation, we're starting to see multi-decade highs for price increases. Inflation in 2020 was just 1.2% as the COVID-19 pandemic dramatically disrupted economic activity all over the world, but the gradual return to normalcy, combined with trillions of dollars in economic stimulus, led to a 4.7% inflation rate in 2021. Inflation has continued to rise, however, and (for now) peaked at 9.1% in June 2022, marking the highest level in more than 40 years.
What causes inflation?
What causes inflation?
Before we get into the causes of inflation, it's important to point out that a modest level of inflation is part of a healthy economy. It is never fun to watch prices go higher for everyday purchases, but it is an economic phenomenon that can be more helpful than harmful over the long run, as long as it's kept under control.
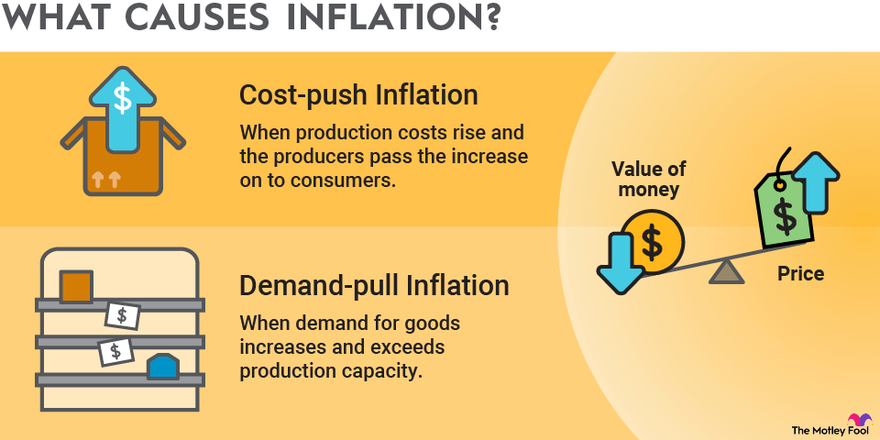
There are two main drivers of inflation:
- Cost-push inflation: This occurs when production costs rise for certain goods, and the producers pass the increased costs on to consumers. For example, if the price of lumber rises, it typically leads to a rise in home prices since it costs more for builders to produce homes. Labor costs are also in this category since a more expensive labor force adds to the cost of producing items.
- Demand-pull inflation: This happens when demand for goods increases and causes prices to rise. Continuing with the homebuilding example, a low inventory of homes for sale relative to the number of buyers in the market is a good example of demand-pull inflation.
It's also worth noting that these two types of inflation aren't completely independent in the real world. In fact, different causes of inflation can create a cycle of rising prices. Let's say that the cost of chicken wings increases by 10%, so manufacturers pass the cost to their customers. Now the customers need more money to maintain their standard of living, so their employers come under pressure to raise wages. As wages increase, consumers have more money, which can lead to more demand-pull inflation, and the cycle continues. In a nutshell, there often isn't just one cause of inflation. Rather, it is typically the result of several different factors.
As a current example, the U.S. government injected trillions of dollars into the economy during the COVID-19 pandemic. The cash influx created more consumer demand for goods and services. Supply chain disruptions caused by the pandemic have limited the amount of products available, which disrupts supply and demand dynamics even further. On top of all that, workers have more options than ever with the rise of the gig economy (Uber, DoorDash, etc.), which has created a labor shortage and upward wage pressure on employers.

The primary way inflation is determined is by comparing the Consumer Price Index, or CPI, to its historical values.
Combatting inflation
How does the U.S. combat inflation?
There are several ways governments can combat inflation, but the main tool used in the U.S. is the monetary policy of the Federal Reserve Board.
The Federal Open Market Committee (FOMC), which is the policy-making arm of the Federal Reserve, has a dual mandate -- to maximize employment and control inflation. Its main tool is interest rates.
The federal funds rate is controlled by the FOMC and is the benchmark interest rate used for banks to lend each other money overnight. Several other interest rates (such as the prime rate and credit card interest rates) are directly tied to the federal funds rate as well.
Without getting too deep into an economics discussion, when the Federal Reserve raises interest rates, it is encouraging lenders to do the same and reduce the available money supply in the economy.
In addition to interest rates, the Federal Reserve can choose to buy and sell Treasury securities from its own balance sheet. By selling Treasuries from its balance sheet, the Fed removes money from the economy, which can help to cool inflation.
Inflation and stocks
How does inflation affect stocks?
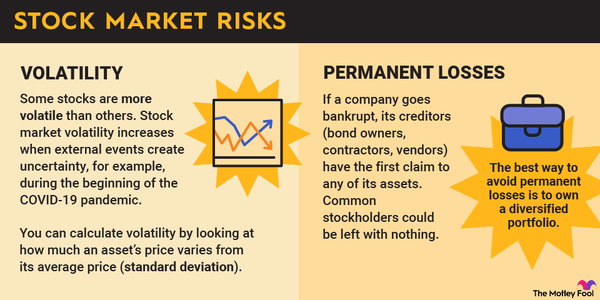
Different companies are affected by inflation in different ways. If a company can raise prices without significantly affecting demand, inflation could lead to higher corporate profits. On the other hand, if rising prices result in a decline in demand for a company's product, or make producing a product more expensive, a high rate of inflation could be a negative catalyst for a stock.
Some companies can directly make more money from inflation, such as banks. Think of it this way: As prices rise, customers take out larger loans for purchases. Larger loan balances equal more interest income. Plus, since inflation is typically accompanied by rising interest rates, banks tend to generate more net interest income as a result of inflationary environments.
Having said all that, inflation is a generally negative catalyst for the stock market. Inflation tends to cause consumer spending to drop, and investors have less cash available to invest in the stock market due to the need to spend an increasing percentage of their income on everyday expenses.
Measuring inflation
Ways to measure inflation
As mentioned previously, the primary way inflation is determined is by comparing the Consumer Price Index, or CPI, to its historical values. We won't get too deep into the mathematics, but the CPI is designed to represent the cost of a basket of goods and services commonly purchased by urban workers.
Versions of the Consumer Price Index (CPI)
The version of the CPI used to measure inflation is the CPI-U, or the Consumer Price Index for All Urban Consumers. Although the phrase "urban consumers" may imply that this index only tracks a select group, the Bureau of Labor Statistics (BLS) claims that 87% of the U.S. population falls under the scope of the index.
While the CPI-U is the most broad-based version of the CPI, it's important to mention that it isn't the only way to measure inflation. There are other versions of the CPI that can be more useful in certain situations, such as:
- CPI-W: The Consumer Price Index for Urban Wage Earners and Clerical Workers. This is designed to be more representative of the costs incurred by hourly wage and clerical workers. For example, hourly workers tend to spend a greater percentage of their income on transportation, so it is weighted more heavily in the CPI-W.
- CPI-E: The Consumer Price Index for the Elderly. This is designed to gauge inflation affecting senior citizens. For example, seniors tend to spend much more on healthcare costs than the general population, so healthcare is more heavily weighted in the CPI-E.
In addition, you may hear two inflation numbers in the news. The "headline" inflation number is based on the CPI-U. However, you may also hear about the "core" inflation rate. Core inflation is the CPI-U but excludes the impacts of food and energy prices, which tend to be more volatile than most other costs. For example, if gasoline prices double, it would cause the CPI-U to move higher, but it wouldn't be considered in the core inflation rate.
Related Investing Topics
Why inflation is so important to investors
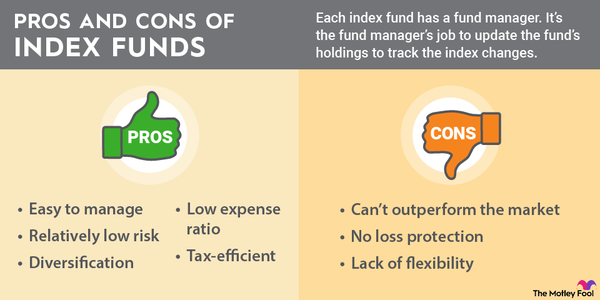
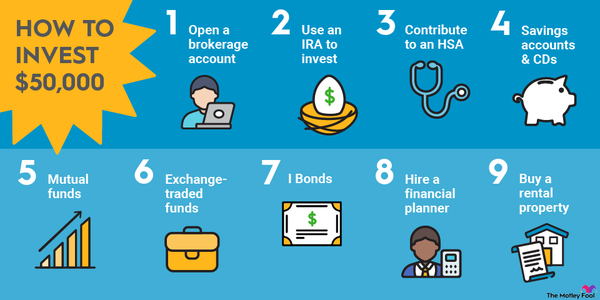
The main thing to understand is that cash actually loses value over the long run. This is why investing is so important. Stocks, bonds, and even real estate have historically produced gains significantly above the inflation rate. Savings accounts, CDs, money market funds, and other cash-based investments have not.
It's absolutely true that the stock market tends to perform better during periods of lower inflation than it does with higher inflation. However, the market does tend to produce strong returns relative to savings accounts and fixed-income investments such as bonds even in inflationary times. In fact, during the 1979-81 period of double-digit inflation, the S&P 500 increased by 28%, and that's not even including dividends.
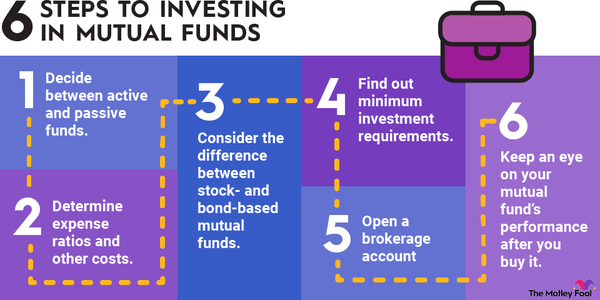
So if you have a bunch of cash sitting around in a savings account, or, worse yet, under your mattress, you should seriously consider putting that money to work. You don't need to be a stock market expert either. A few basic index funds can do the job just fine. Whatever you do, don't let your money lose its value over the years. By not investing, you're literally asking to lose your money's purchasing power.