Volatility is troublesome for many investors. Fluctuations in a stock's price, your portfolio's value, or an index's value can cause you to make emotionally driven investing decisions. By knowing how to calculate volatility, you can get a better sense of what to expect going forward.

How to calculate volatility
In order to analyze volatility, you need to create a data set that tracks the price or value changes of a stock, your portfolio, or an index at a regular interval (such as daily). If you know a stock's or an index's daily closing price, ideally over a long period of time, then you can compute as a percentage the amount the stock's price or index's value changes from day to day.
Investors use this data to calculate a stock price or index's standard deviation, which is used as a proxy measure for volatility. The best way to calculate standard deviation is to use a spreadsheet program such as Microsoft Excel, so keep reading for a complete example of calculating price or value volatility using Excel.
Calculating volatility using Microsoft Excel
While using a large data set is necessary to achieve accuracy by way of statistical significance, here we'll work with just 10 days of closing values for the S&P 500 (SNPINDEX:^GSPC).
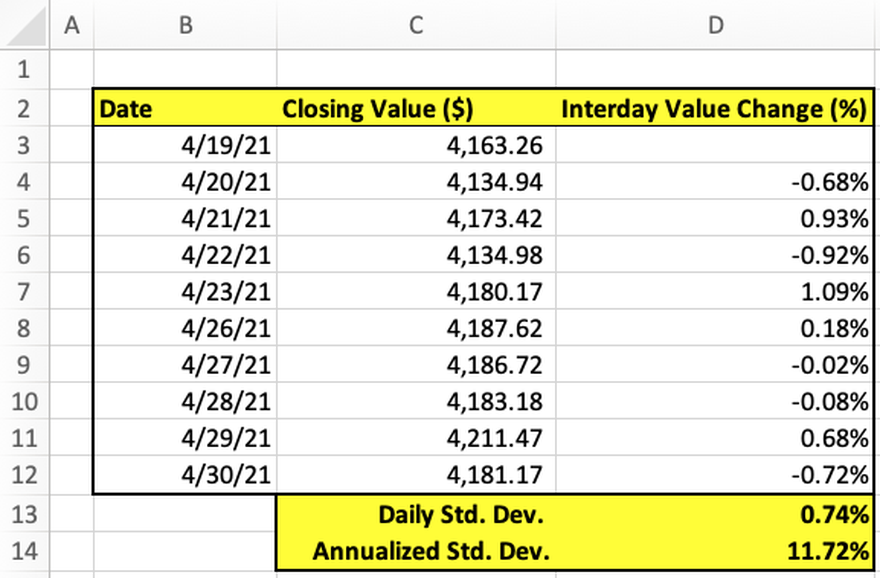
Using data in Column C, calculate the interday change in the value of the index. Starting with cell D4, the formula is simply the current day's closing value divided by the previous day's closing value minus 1, or (C4/C3) - 1.
- Pro tip: simply drag this formula down to the end of the dataset in row 12 for all values in Column D to populate.
Find the daily standard deviation — daily volatility — of the sample by using the STDEV.S function. Type "=STDEV.S(D4 : D12)" in cell D13 to find the daily volatility of the S&P 500 within the sample data.
Find the annualized standard deviation — annual volatility — of the the S&P 500 by multiplying the daily volatility by square root of the number of trading days in a year, which is 252. In cell D14, type "=SQRT(252)*D13" to determine that the annual volatility of the index is 11.72%.
You can also calculate weekly volatility by multiplying the daily volatility by square root of the number of trading days in a week, which is 5. Using the formula "=SQRT(5)*D13" indicates that the weekly volatility is 1.65%.
Calculating portfolio volatility
You may be interested in learning how to calculate the volatility of your portfolio, given that most people don't hold just a single stock position. Portfolio volatility is a measure of portfolio risk, meaning a portfolio's tendency to deviate from its mean return. Remember that a portfolio is made up of individual positions, each with their own volatility measures. These individual variations, when combined, create a single measure of portfolio volatility.
To calculate the volatility of a two-stock portfolio, you need:
- The weight of stock 1 in the portfolio
- The weight of stock 2 in the portfolio
- The standard deviation (volatility) of stock 1
- The standard deviation of stock 2
- The covariance, or relational movement, between the stock prices of stock 1 and stock 2
To calculate portfolio volatility, the logic underlying the equation is complicated, but the formula takes into account the weight of each stock in the portfolio, the stocks' standard deviations, and all of their covariances. While adding additional assets to your portfolio makes calculating its volatility increasingly complex, don't worry too much about mastering the formulas and just maintain a good understanding of the broader volatility concept.
Related investing topics
What standard deviation doesn't tell you
The biggest shortcoming to using standard deviation to calculate volatility is that standard deviation measurements are based on the assumption that returns are normally distributed. With normal distribution, also known as a bell curve, more results cluster near the center and fewer results are significantly above or below average.
In actuality, stock prices and index values often have asymmetrical distributions and can stay unusually high or low for long periods of time. In addition, a stock's or index's volatility tends to change over time, which challenges the assumption of an unchanging statistical distribution of returns.
While performing historical volatility calculations helps to construct a view of how much volatility to expect going forward, investors only have data for what's already occurred. Computing historical data can still be useful because this information can predict how a security's price will move in the future.
With price fluctuations normally distributed, the stock's price tends to stay within one standard deviation — its implied volatility — of the stock's current price for 68% of price changes. Calculating the implied volatility of your portfolio and monitoring risk are crucial to make sure your portfolio behaves in the way you expect regardless of market conditions.