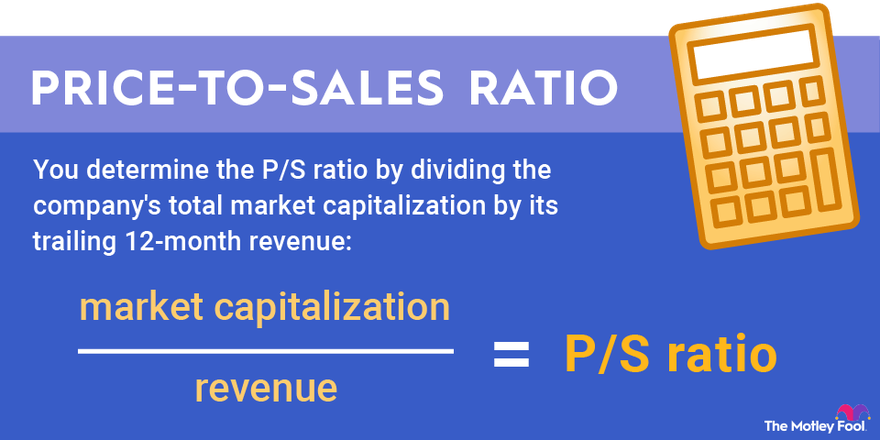
What is the price-to-sales ratio?
The price-to-sales ratio, also known as "price/sales," "P/S ratio," or "list-price-to-sale-price ratio," is one of many valuation metrics for stocks. The ratio describes how much someone must pay to buy one share of a company relative to how much that share generates in revenue for the company. Generally speaking, the lower the P/S ratio, the better.

Price-to-sales ratio formula
You determine the P/S ratio by dividing the company's total market capitalization by its trailing 12-month revenue:
That means the P/S ratio is based solely on revenue, not on profits or cash flow. As a result, it's especially useful for comparing the valuations of companies with little or no profit or negative cash flow.
Amazon (AMZN -1.35%), for example, is notorious for having been unprofitable until 2003, seven years after it went public. On Jan. 1, 2003, Amazon's market capitalization (the sum of the price of all its outstanding shares) was $7.3 billion. Its trailing 12-month revenue was $3.9 billion. Divide $7.3 billion by $3.9 billion and you get about 1.8, which was Amazon's P/S ratio at the time.
An example of price-to-sales ratio analysis
By using the P/S ratio, we can compare Amazon's valuation on Jan. 1, 2003, with its performance leading up to that point:
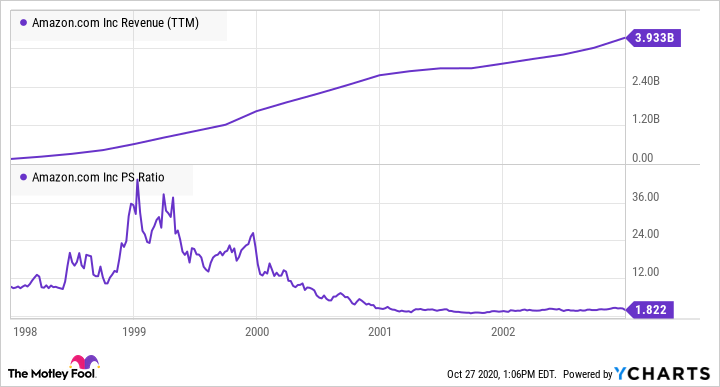
Due largely to how quickly Amazon was increasing its revenue, its price-to-sales ratio fell from a high of about 40 to 1.8. As a result, Amazon looks like a comparative bargain in 2003. (And it was: The stock has appreciated more than 22,000% since then.)
Comparing companies
The price-to-sales ratio can also be used for comparing companies -- including unprofitable companies -- against one another. Here, for example, is a comparison of two cloud-computing solution stocks, Snowflake (SNOW -4.15%) and Datadog (DDOG -1.32%).
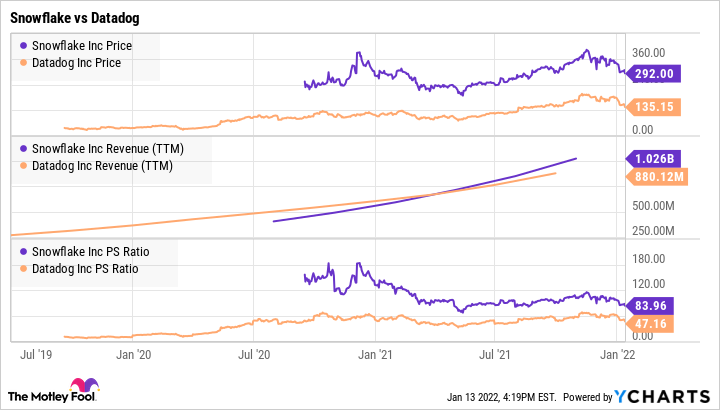
Snowflake's price-to-sales ratio is significantly higher than Datadog's. From a P/S ratio point of view, that makes Snowflake a more expensive stock. But that doesn't mean it's a worse investment. Snowflake could be worth the premium price because it's accruing revenue faster than Datadog. Remember, Amazon made a great investment in the early 2000s despite its sky-high P/S ratio because it was adding revenue at such a rapid clip.
The P/S ratio is a good starting point to compare two companies' stock, but investors should dive deeper to understand whether one stock is a better buy than the other.
What is a good price-to-sales ratio?
It depends on the company and the industry.
Grocery stores, for example, have massive amounts of sales but relatively low profit margins, so it's not unusual for grocery store stocks to see P/S ratios of 0.2 or even 0.1. A higher-margin company could have a much higher P/S ratio and still be considered a bargain. Amazon's P/S ratio, for example, has ranged between 2 and 6 for the past five years.
Because P/S ratio is a rear-facing metric that looks only at past performance, fast-growing companies such as Snowflake or Datadog can easily see massive P/S ratios as investors bid up the price in expectation of future sales growth.
Your best bet when looking at a company's P/S ratio is to compare it with the P/S ratios of similar companies in the same industry.
One piece of the puzzle
The price-to-sales ratio is a useful tool for evaluating companies, especially those with negative earnings or cash flow that can't be measured through the price-to-earnings (P/E) ratio or price-to-free-cash-flow ratio. But the P/S ratio isn't very useful on its own.
For example, if one company has a low P/S ratio but an unreasonably high debt load, it isn't necessarily a good value. A company's growth rate, profit margins, and competitive advantages should also be considered. Snowflake's P/S ratio might be much higher than Datadog's, but Snowflake also has no debt, is growing faster, and has a higher gross profit margin.
Investing decisions should never be made on the basis of a single metric, and the P/S ratio is no exception.
Related investing topics
Going beyond the P/S ratio
Calculating the price-to-sales ratio for any given stock is very easy. Just divide the market cap by the company's total revenue. One of the best ways to use the P/S ratio is by comparing it to a stock's historical average. Alternatively, you can use it to compare the valuations of two companies' stocks to help determine which is a better fit for your portfolio. Ultimately, however, you should dig deeper for context around why the market may be trading a stock at a certain P/S ratio to make the best investment decisions possible.