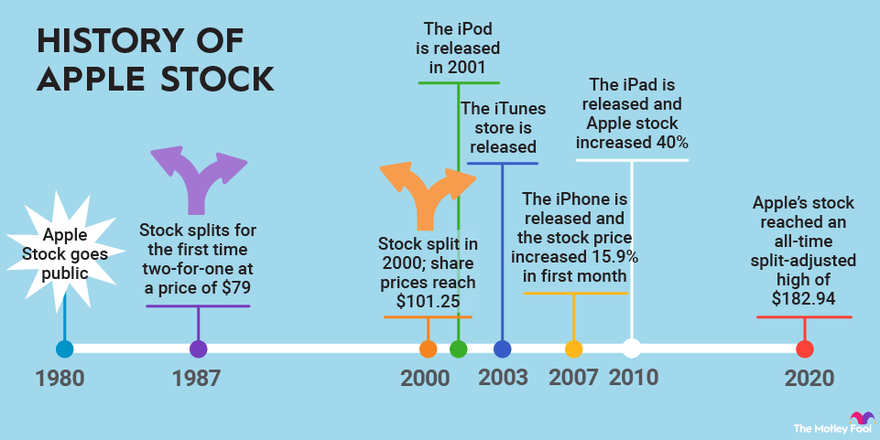
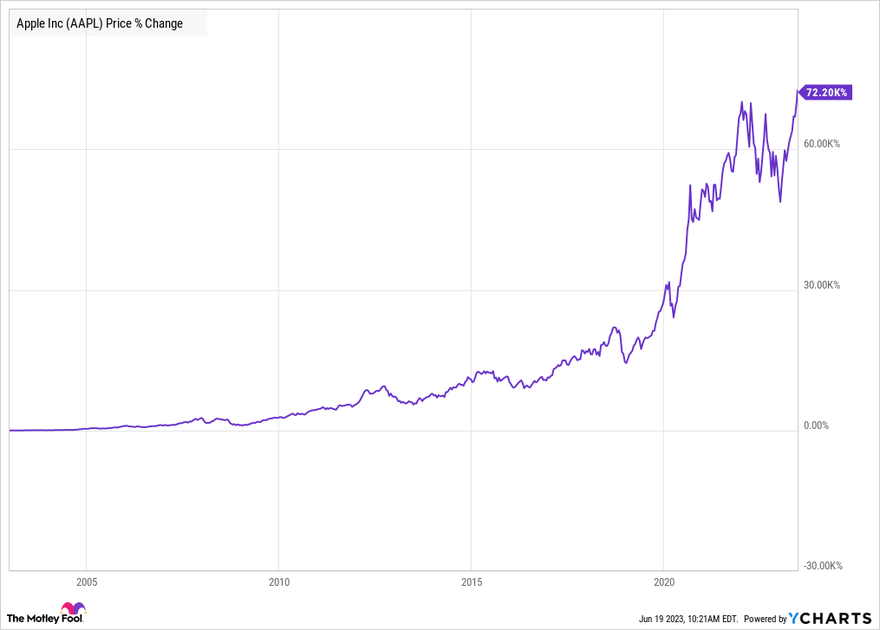
Stock splits can stir up a lot of investor excitement. Apple (AAPL 0.64%) is a perfect example. Since the tech hardware leader went public more than 40 years ago, Apple has split its shares five times and created massive shareholder wealth.
Apple’s stock split history
Apple’s stock split history
Apple is one of the most valuable companies in the world, with a current market cap of more than $2.9 trillion.
It had its initial public offering (IPO) on Dec. 12, 1980. The IPO price was $22, or $0.10 per share, when adjusting for the five stock splits it has initiated in its history as a public company.
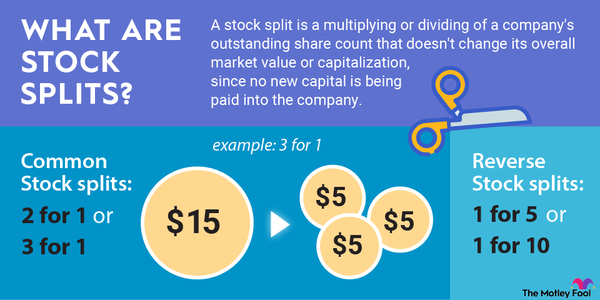
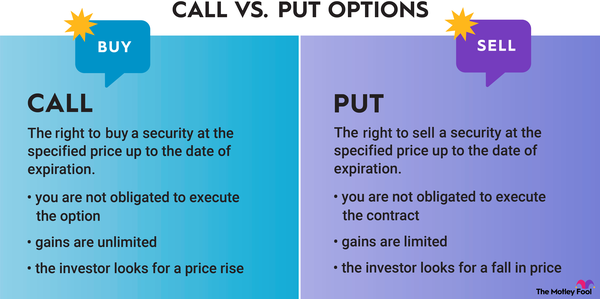
Some investors get excited about stock splits because they believe they make the stock cheaper. A stock split is the result of the company issuing new shares, so as a result, the price of each share goes down.
Stock Split
But the valuation usually remains unchanged since the decrease in stock price and increase in shares outstanding usually offset each other. There's no change to a company’s market capitalization or enterprise value.
Nevertheless, some investors think the split results in increased investor attention and causes the share price to rise before and after a stock split. Here’s what Apple’s history tells us regarding this belief.
Apple stock splits: 1980 to 2023
Apple stock splits: 1980 to 2023
Apple has endured some tumultuous times, especially in its first two decades as a publicly traded stock. For the 20 years after its 1980 IPO, the share price only doubled in value through Dec. 31, 2000.
Much like the stock splits in Apple’s early history, the company’s stock splits in the 2000s and later were preceded by a run-up in stock price. Performance in the year after the split was respectable, too. After another 2-for-1 split in 2005, Apple divided its last two splits by a much greater amount in 2014 and 2020.
| Stock Split Date | Stock Split | Apple Market Cap | Stock One Year % Return Prior to Split | Stock One Year % Return After Split |
|---|---|---|---|---|
| June 16, 1987 | 2-for-1 | $5 billion | 131% | 7% |
| June 21, 2000 | 2-for-1 | $18 billion | 140% | -60% |
| Feb. 28, 2005 | 2-for-1 | $37 billion | 275% | 53% |
| June 9, 2014 | 7-for-1 | $565 billion | 49% | 36% |
| Aug. 28, 2020 | 4-for-1 | $2.1 trillion | 139% | 19% |
Related investing topics
Lessons from Apple’s stock split history
Lessons from Apple’s stock split history
Apple’s history of stock splits shows that the hype leading up to the new shares being doled out to shareholders is greater than the event itself. Apple’s share price performance in the year after a split is a bit more of a mixed bag.
However, more important than Apple’s stock splits is the business’s performance. In each of the five times that the tech hardware designer has split its stock, it experienced strong growth in sales and profitability. The exception was in 2000, when sales dipped between the dot-com bust and the release of the iPod in 2002.
The lesson: Companies such as Apple split their stocks for good reasons, which include managing stock-based compensation for employees and share repurchase programs to return excess cash to shareholders. However, as exciting as stock splits may seem, the real reason to buy and hold a stock like Apple for the long term is because of secular growth trends that benefit the company.