A stock market crash occurs when there is a significant decline in stock prices. There's no specific definition of a stock market crash, however, the term usually applies to occasions in which the major stock market indexes lose more than 10% of their value very quickly.
Market crashes typically happen without warning, often on the heels of a long bull market run during which stock prices steadily rise. The hallmark of a stock market crash is panic-selling by investors who attempt to quickly liquidate their positions to either curb their losses or satisfy a margin call.
Although a stock market crash can occur quickly, many of the market's biggest crashes have had effects that were long-lasting and deep. Here's a brief look at some of the stock market's most notable crashes.
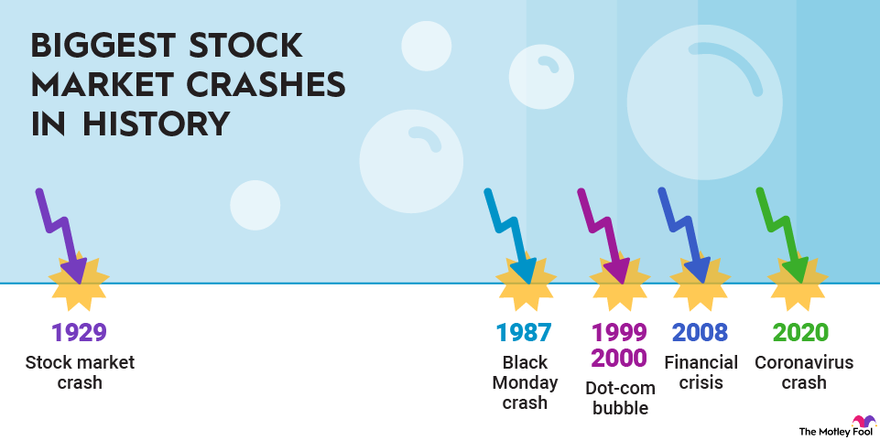
Biggest crashes in the history of the stock market
Biggest crashes in the history of the stock market
1929 stock market crash
1929 stock market crash
The worst stock market crash in history started in 1929 and was one of the catalysts of the Great Depression. The crash abruptly ended a period known as the Roaring Twenties, during which the economy expanded significantly and the stock market boomed.
The Dow Jones Industrial Average (DJINDICES:^DJI) rose from 63 points in August 1921, to 381 points by September 1929 -- a sixfold increase. It started to descend from its peak on Sept. 3, before accelerating during a two-day crash on Oct. 28–29. On Black Monday, the Dow tumbled almost 13% and declined almost 12% more on Black Tuesday.
By mid-November 1929, the Dow had lost about half its value. The stock market was bearish, meaning its value had declined by more than 20%. The Dow continued to lose value until the summer of 1932 when it bottomed out at 41 points, a stomach-churning 89% below its peak. The Dow didn't regain its pre-crash value until 1954.
The primary cause of the 1929 stock market crash was excessive leverage. Many individual investors and investment trusts had begun buying stocks on margin. Many only paid 10% of the value of a stock to acquire it under the terms of a margin loan. The investment trusts also often purchased shares of other highly leveraged investment trusts, making the trusts' fates highly intertwined. Consumers, too, increasingly purchased items on credit. When the debt bubble burst, it caused the greatest stock market and economic crash in modern history.
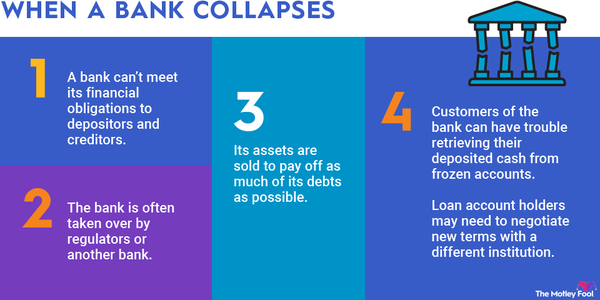
Bank Run
Black Monday crash of 1987
Black Monday crash of 1987
On Monday, Oct. 19, 1987, the Dow Jones Industrial Average plunged almost 22%. Black Monday, as the day is now known, marks the biggest single-day decline in stock market history. The remainder of the month wasn't much better; by the start of November 1987, most of the major stock market indexes had lost more than 20% of their value.
No single event caused the stock market to crash in 1987. Instead, a series of factors drove the sell-off, including a widening U.S. trade deficit, computerized trading, and tensions in the Middle East. The rise of program trading, which occurs when computers make automated trades, likely played the biggest role in this crash. The computers tended to produce more buy orders when prices were rising and more sell orders when prices fell. As sell orders flooded the market on Oct. 19, it caused other investors to sell in a panic.
Because the Black Monday crash was caused primarily by programmatic trading rather than an economic problem, the stock market recovered relatively quickly. The Dow started rebounding in November 1987 and had recouped all its losses by September 1989.
Dot-com bubble of 1999-2000
Dot-com bubble of 1999-2000
During the late 1990s, the values of internet-based stocks rose sharply. As a result, the technology-dominated NASDAQ Composite Index (NASDAQINDEX:^IXIC) surged from 1,000 points in 1995 to more than 5,000 in 2000. But in early 2001, the dot-com stock bubble started to burst. The NASDAQ peaked at 5,048.62 points on March 10. The index would go on to plummet by 76.81% until it reached a low of 1,139.90 points on Oct. 4, 2002.
The primary cause of this crash was overvalued internet stocks. Many investors speculated that dot-com companies -- even those without revenues -- would one day become extremely profitable. As a result, they poured money into the sector, driving up the valuation of every company with "dot-com" in its name. The stock market bubble burst when the Federal Reserve Board tightened its monetary policy, constraining the flow of capital. The NASDAQ did not again rise to its 2001 peak until almost 15 years later.
Financial crisis of 2008
Financial crisis of 2008

In 1999, the Federal National Mortgage Association (FNMA or Fannie Mae) wanted to make home loans more accessible to those with low credit ratings and less money to spend on down payments than lenders typically required. The subprime borrowers, as they were called, were offered mortgages with payment terms, such as high interest rates and variable payment schedules, that reflected their elevated risk profiles.
This increased availability of mortgage debt appealed to both previously ineligible borrowers and investors, fueling explosive growth in mortgage originations and home sales. At the same time, consumers, many of them new homeowners, took on additional debt to buy other goods. Companies seeking to capitalize on the opportunities afforded by the surging economy also heavily indebted themselves. Financial institutions, similarly, used cheap debt to boost the returns on their investments.
The debt-fueled stock market started to show signs of impending collapse in March, 2007, when the investment bank Bear Stearns could not cover its losses linked to subprime mortgages. Bear Stearns' failure was not enough by itself to cause the stock market to crash -- it kept rising, to 14,164 points on Oct. 9, 2007 -- but by September 2008, the major stock indexes had lost almost 20% of their value. The Dow didn't reach its lowest point, which was 54% below its peak, until March 6, 2009. It then took four years for the Dow to fully recover from the crash.
Coronavirus crash of 2020
Coronavirus crash of 2020

The most recent stock market crash occurred in 2020 as COVID-19 spread worldwide. During the week of Feb. 24, the Dow Jones and S&P 500 tumbled 11% and 12%, respectively, marking the biggest weekly declines to occur since the financial crisis of 2008. The Dow would go on to decline by 9.99% on March 12 -- its largest one-day drop since Black Monday of 1987 -- followed by an even deeper plunge of 12.9% on March 16.
However, unlike previous crashes whose recoveries required years, the stock market rebounded to its pre-pandemic peak by May 2020. Fueling the rapid recovery was an enormous amount of stimulus money, with the Federal Reserve slashing interest rates and injecting $1.5 trillion into money markets, and Congress passing a $2.2 trillion aid package at the end of March.
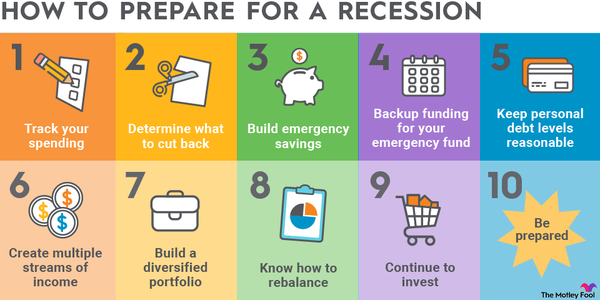
Lessons to learn from the biggest stock market crashes in history
Investors can learn several valuable lessons from studying stock market crashes. A notable one is that they usually follow a debt-fueled boom. Given the devastating potential of market crashes, investors should avoid using margin debt since it can make market crashes even worse.