Dividend stocks have a long track record as excellent investments, whether you are looking to increase your wealth or want a steady source of income. But paying a dividend is only the start. The best dividend stocks are the companies that can deliver dividend growth over many years and even decades.
But sometimes just picking a dividend stock, buying it, and hoping for the best isn't good enough. For investors who want to be sure they buy dividend stocks that will meet their expectations, doing dividend growth homework can go a long way. In other words, you should do some modeling to determine if a stock will meet your long-term dividend expectations and if the price you're paying is reasonable.
Let's take a closer look at dividend growth modeling and how it can help you invest better.

What is the dividend growth model?
The dividend growth model is a mathematical formula investors can use to determine a reasonable fair value for a company's stock based on its current dividend and its expected future dividend growth.
The basic formula for the dividend growth model is as follows:
Price = Current annual dividend ÷ (Desired rate of return-Expected rate of dividend growth)
This formula can be a helpful tool to determine what a fair price for a stock would be based on different potential outcomes. However, investors must understand that a lot of assumptions go into a modeling tool like this one.
For instance, one common practice is to use a company's recent historical dividend growth as the expected rate of future growth. But that may or may not work out in reality.
A real-world example of this method leading to very different outcomes is the case of Coca-Cola (KO 0.15%) and Wells Fargo (WFC -0.26%). From 2015 to 2019, Wells Fargo increased its dividend at more than twice the rate of Coca-Cola:
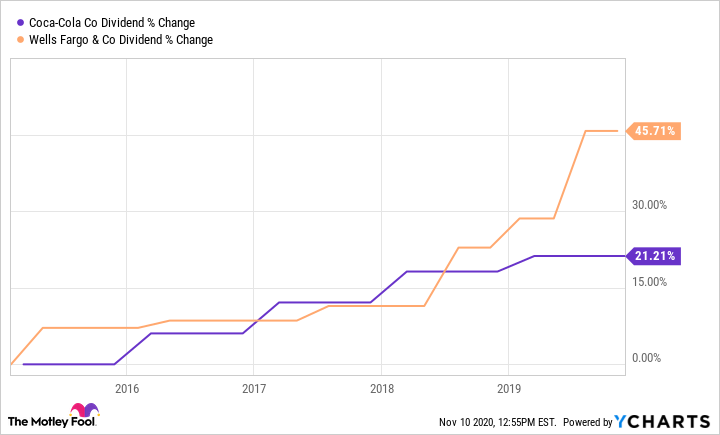
At the beginning of 2020, both companies' stocks traded for similar prices of between $53 and $55 per share. Wells Fargo paid the higher dividend and had the higher recent dividend growth rate.
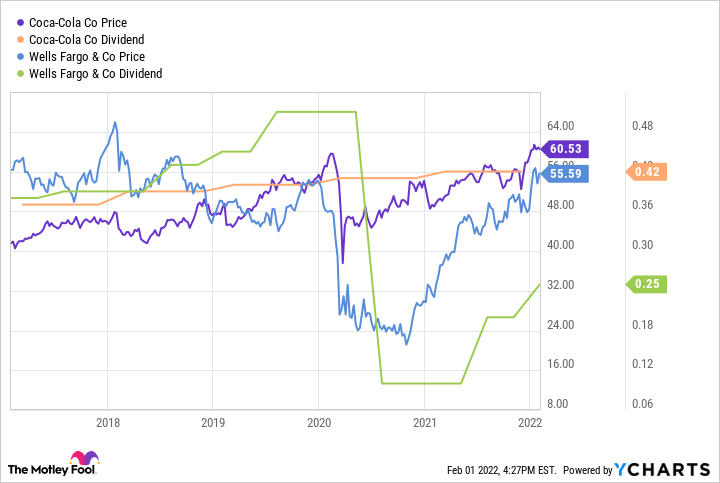
Then the COVID-19 pandemic and global recession happened. Wells Fargo struggled and was forced by regulators to slash its dividend to preserve capital, while Coca-Cola kept steadily paying its dividend.
The lesson is that, in reality, assumptions don't always work out, often for reasons you simply cannot foresee, such as a global pandemic. As a result, the dividend growth model can be a handy tool for working through various scenarios, including those involving low returns. But it's not a substitute for building a diversified portfolio of companies that aren't exposed to the same kinds of economic or industry-specific risks.
This example is also a reminder of how dividends can affect a stock's price. Coca-Cola, a Dividend King that's increased its dividend every year for almost six decades, had a relatively steady stock price through this whole period -- because shareholders can always rely on the dividend payment. Wells Fargo's stock price was already decreasing despite a growing dividend prior to the drop. Then its stock cratered when the dividend was cut.
When using models such as the dividend growth model and the others discussed below, it's important to factor in a margin of safety. Using a margin of safety means you only buy a stock if it trades for significantly less than its valuation. Many value investors require a margin of safety of at least 20% or 30%.
Looking back at Wells Fargo in early 2020, it had a dividend of $2.04 per share. If we use an 11% required rate of return and its historical growth rate of 7.8%, its implied valuation was $63.75 ($2.04 / (11%-7.8%)).
While that may have looked attractive given that the stock price was around $53, the margin of safety was just under 16%. That's not quite high enough for a bank that had recently experienced issues and had been fined by the government over a scandal involving fake accounts. If the bank stock had been priced lower to begin with, it likely wouldn't have fallen after its dividend cut in 2020.
Dividend models
While using the dividend growth model can be a handy way to work through various scenarios to determine if a stock's current price represents a fair value, there are other formulas you can use to model the value of a company's future cash flows. These are often used with a cost-of-capital adjustment to discount the value of those future cash flows.
The Gordon Growth Model
The Gordon Growth Model is a means of valuing a stock entirely based on a company's future dividend payments. This model makes some assumptions, including a company's rate of future dividend growth and your cost of capital, to arrive at a stock price.
The Gordon Growth Model is a variation of the discounted cash flow model, which is widely used by investment analysts. The model forecasts future dividends based on the current amount and a growth rate, then discounts each dividend back to the present day. The sum total is an estimate of the stock's value.
The future dividends are discounted back to the present to determine their present value. Because money is worth more to you now (not only do you have it now, but you could invest it), potential future money needs to be discounted for conservative analysis.
Where discounted cash flow models typically forecast cash flows out to a certain date and assume the company will cease to exist at that point or be acquired, the Gordon Growth Model's assumptions imply that the company will exist indefinitely. This may sound aggressive, but, in reality, the model discounts the values of dividends.
We can use the Wells Fargo valuation above as an example. The calculation was ($2.04 / (11%-7.8%)). So, $2.04 is the annual dividend, 11% is the discount rate or required rate of return, and 7.8% is Wells Fargo's dividend growth rate. The Gordon Growth Model calculates an intrinsic value of $63.75 per share.
Variations on the Gordon Growth Model
Two common variants that do the same thing -- value a stock entirely according to future dividends -- are the one-period dividend discount model and the multiperiod dividend discount model. While the Gordon Growth Model is a simple formula for valuing a stock based on future dividends after adjusting for the cost of capital, these two variants apply a more complex formula to value dividends over a specific period.
Be conservative on dividend growth
Dividend modeling can be helpful for valuing a stock, but it's heavily influenced by assumptions. There are the calculations and there's what happens in the real world. In other words, don't get too caught up in trying to be precise with your modeling; the extra time you invest in trying to get perfect calculations won't improve the end result in the real world.
A famous saying in finance is that financial models are like the Hubble Space Telescope. Move it a fraction, and you're in a totally different galaxy.
A better approach is to hedge toward being conservative with your projections. The more optimistic your expected rates of dividend growth, the higher the intrinsic value you will arrive at. If a company fails to deliver on your expected future dividend growth, your future returns could be affected.
The biggest lesson? Be conservative in your expectations. Accept the fact that your modeling is only a helpful part of the broader framework that makes up your investing strategy, and always insist on a margin of safety.