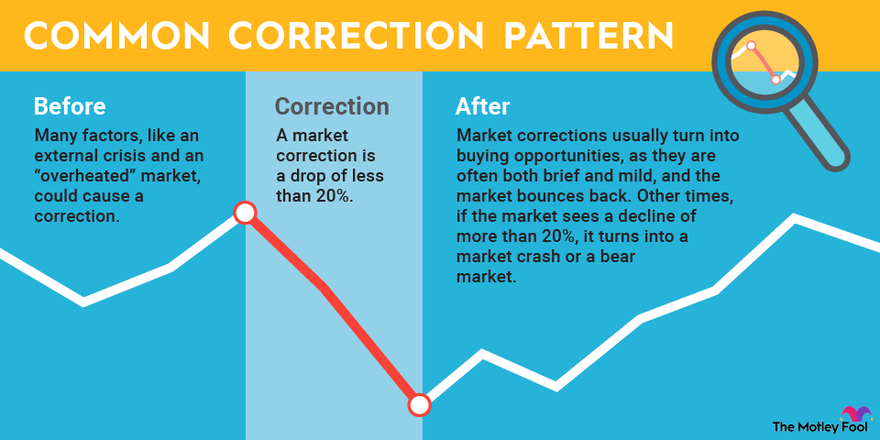
Seems like every time the stock market goes up for any length of time, someone on Wall Street starts forecasting imminent doom. Usually, this involves predicting the dreaded "stock market correction." A stock market correction is a drop of between 10% and 20% in a major market index.
Read on to learn when you can expect a market correction, what they mean for your portfolio, why you shouldn't worry about them, and how to use them to your advantage.
Correction vs. crash
Correction vs. crash
The most important thing to know about a market correction is this: You won't know it's a market correction until it's officially over.
A market correction is by definition a drop of less than 20%. Between the time when the market enters the "correction territory" of a more-than-10% decline and when it stops falling, you won't know if it's "just" a correction, or a more serious market crash -- usually defined as a rapid market drop of more than 20%. Or, potentially, it could become a bear market, a prolonged period of market decline of more than 20%.
Bear Market
What causes a correction?
What causes a correction?
Market corrections and crashes can be triggered by a number of things.
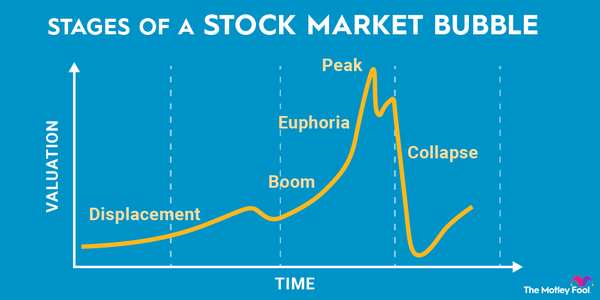
Sometimes it's an external crisis, like the coronavirus pandemic in March 2020. Other times, a particular industry or economic sector implodes and sends ripples across the entire market, as with the bursting of the dot-com bubble in 2000 or the housing crash and resulting financial crisis of 2008.
Other times, there's just a sense that the market is "overheated," meaning stock valuations have gotten too high. If big institutional investors make that determination and pull money out of the market, the resulting small drop can send retail investors into a selling panic, resulting in a self-fulfilling prophecy.
Crises don't always trigger corrections, though. When oil prices collapsed in 2014, the bull market continued unabated. Investor sentiment, economic indicators, global politics, and breaking news all play a role in determining whether and when a correction occurs...or doesn't.
Take, for example, this chart showing the Dow Jones Industrial Average and S&P 500 from May-August 2008:
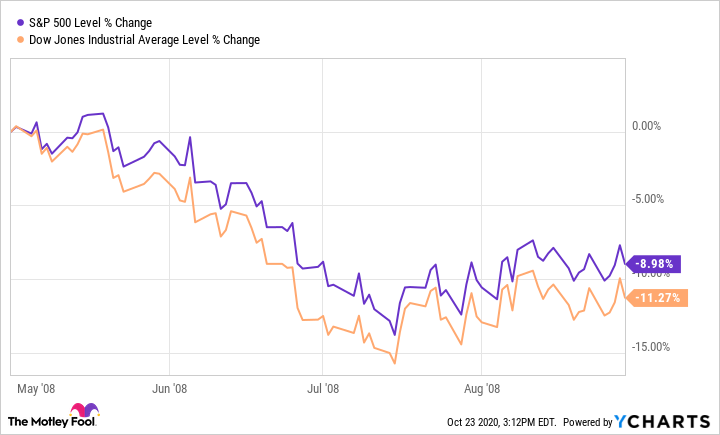
This looks like a classic "market correction." Both the Dow and the S&P 500 fell between 10% and 20% (as of mid-July), but the market rebounded a bit immediately afterward and then crept slightly upward.
Unfortunately, here's what happened next:
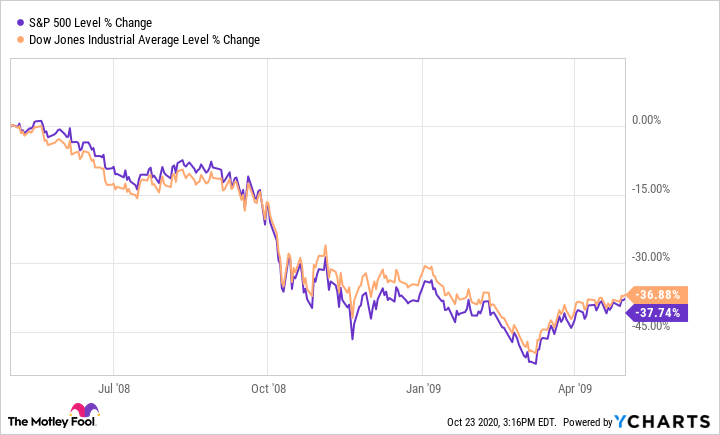
This, of course, was the crash that triggered the Great Recession, but notice how similar this chart looks to the one above: After the market hits bottom in March 2009, we see an immediate bounce, and then what looks like slow growth resuming. Of course, nobody knew at the time that the bear market had truly ended, and that we were starting the longest bull market in U.S. stock market history.
One final note: Sometimes, if people are evaluating bear markets as well as crashes and corrections, they'll just refer to all three as corrections. So don't be surprised if you encounter the term market correction used to describe a major drop like the one above. Similarly, a crash can trigger a more prolonged bear market, so those terms are sometimes used interchangeably as well.
Can you predict a market correction?
Can you predict a market correction?
The short answer: no.
The more complete answer: Market corrections have been a part of the ebb and flow of the stock market since its inception. Historically, the probability of experiencing a market correction within the next ten years is 100%.
Related Investing Topics
Stock market corrections are great times to buy
Far from a time to panic, market corrections usually turn into outstanding buying opportunities, as they are often both brief and mild. All 28 corrections over the past 50 years have been more than completely erased by a subsequent bull market rally.
What's more, the S&P 500 has spent almost three times as many days over the past 50 years rallying compared to the days it's spent in correction. Though there are no guarantees in the stock market, buying an index fund, or a basket of high-quality stocks within a major index like the Dow or S&P 500, during a correction is about as close to a surefire long-term investment strategy as you're going to get.