The price/earnings-to-growth ratio (PEG ratio) is one of several different ways to value a stock, but it's the only metric that takes a company's earnings growth rate into account.
Most valuation ratios such as price-to-earnings, price-to-sales, and price-to-book are based on backward-looking metrics and don't directly consider a company's growth prospects. Since growth is a key component of a stock's expected return, the inclusion of the growth rate gives the PEG an advantage over the most commonly used alternatives. However, this ratio, like all others, has its pros and cons.
In looking at the PEG ratio, we'll discuss how to calculate it, give an example of how it's used, and examine the best uses for the PEG ratio.
How to calculate the PEG ratio
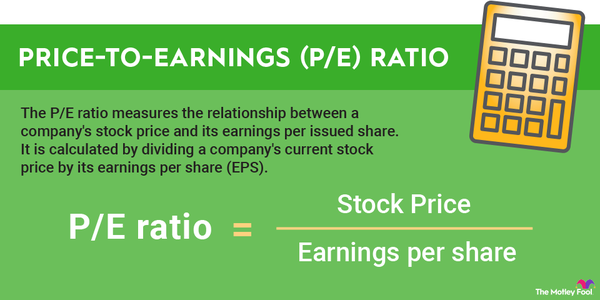
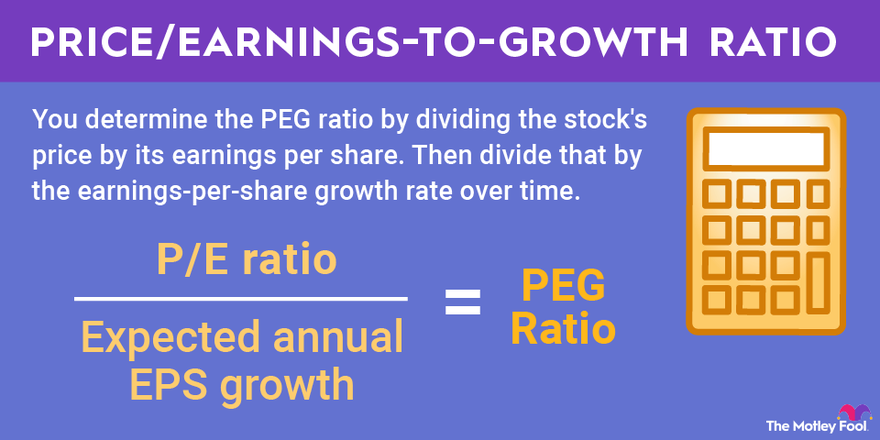
The PEG ratio starts with the P/E ratio but takes it one step further. To get the PEG, you first divide a stock's price by its earnings per share (EPS), just as you would to get the P/E ratio. Once you have the P/E ratio, you divide that by the expected earnings-per-share growth rate over a period of time, often five years. If it's multiple years, you use the compound annual growth rate.
The formula looks like this:
(P/E ratio) / Expected annual EPS growth
The price-to-earnings ratio of a stock can generally be found on a stock market portal like Yahoo! Finance or from your brokerage. Expected growth rates, which are generally determined by Wall Street analysts unless a company has given its own guidance, can likely be found with your brokerage. You may have to do some calculations to determine the growth rate based on the earnings forecasts available.
For example, if a company currently has $1 in EPS and analysts forecast $1.50 in EPS in three years, its compound annual growth rate (CAGR) would be 14.5%. To determine the CAGR, you would divide the last year's EPS by the first year's EPS and take it to the power of 1 / (the number of years between them).
PEG ratio example
To see how we can use the PEG ratio in real life, let's take a look at Meta Platforms (NASDAQ:FB), the tech giant and parent company of Facebook.
Meta had $13.77 in earnings per share in 2021, and it closed at a price of $216.49 on March 18. That gives the stock a P/E ratio of 15.7. The chart below shows the current EPS consensus for the company's next four years.
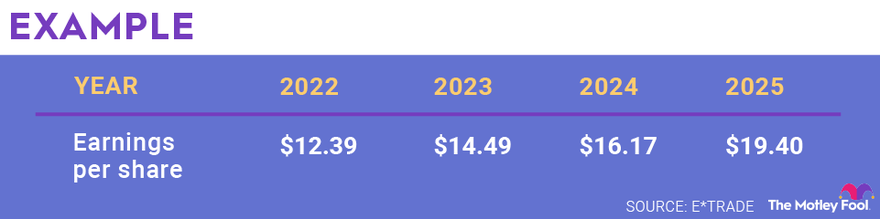
Over the next four years, analysts expects Meta's earnings per share to grow by 41%, or a compound annual growth rate of 9%. Since 15.7 divided by 9 is 1.74, Meta's PEG ratio is currently 1.74.
If you're wondering if that's a good PEG ratio, you'd want to compare to its peers. Currently, the S&P 500 has a PEG ratio of 1.56, and the communications services sector to which Meta belongs has a PEG of just 1.12. That sector may not be the best comparison, however, since it includes slow-growing companies such as Verizon (VZ 0.98%) and AT&T (T -0.43%). Alphabet (GOOGL -1.82%)(GOOG -1.8%), which may be Meta's closest peer, trades at a PEG of 2.09, making Meta look cheap by comparison.
What does the PEG ratio tell you?
The PEG ratio tells you how expensive a stock is relative to its growth rate. The price-to-earnings ratio is the most widely ratio used by investors, but the PEG has a key advantage over the PE ratio in that it adjusts the P/E for growth. Typically, higher P/E ratios signal faster growth rates, but the PEG allows investors to compare stocks with high and low P/E ratios based on their growth rates.
The PEG ratio also offers a simple way for investors to see how cheap a stock is relative to its growth rate. All things being equal, a lower PEG ratio is better.
Traditionally, a PEG ratio of 1 was considered fairly valued, with less than 1 being undervalued and more than 1 being overvalued. Over the past decade, however, price-to-earnings valuations have become stretched because of the rise of the tech sector, which tends to trade at a higher valuation than mature sectors such as energy or tobacco. Because of that shift, you're unlikely to see many stocks with PEG ratios of less than 1 these days since many of the priciest stocks on the market, especially in sectors such as cloud computing, don't even have profits.
Famous fund manager Peter Lynch helped popularize the PEG metric, arguing in his book One Up on Wall Street that 1 was a fair PEG ratio since he believed the rate of growth should approximate the price of the stock.
A PEG ratio of less than 1, assuming the growth forecast is accurate, is a good indicator that a stock will outperform over the next few years.
Advantages and disadvantages of the PEG ratio
There are a number of benefits to using the PEG ratio. The biggest advantage is that it factors in a company's growth rate, making it more convenient than the P/E ratio, which requires investors to do the growth comparison on their own. With the P/E, investors may choose to use a company's P/E ratio based on a future year's earnings, i.e., a forward P/E. Unlike most ratios, the PEG is also forward-looking, making it a true reflection of a stock's expected profits rather than its trailing performance.
However, the PEG can be more difficult to use because growth rates aren't always available or accurate. If a company trades at a low PEG ratio, it could be because the market doesn't believe the growth forecast. Additionally, since the number of years in the PEG ratio can vary, apples-to-apples comparisons can be difficult. In the example of Meta, analysts expect earnings per share to decline this year, which means it wouldn't even have a PEG ratio if we were just using a one-year forecast. By contrast, over the next three years, the PEG ratio would be just 0.86, much lower than the current 1.74.
It's worth remembering that earnings forecasts are less accurate over a longer time, so next year's earnings consensus should be closer to actual earnings than the five-year forecast.
Like other ratios valuation metrics, it's a good idea to use the PEG ratio along with other tools. Investors should also consider the balance sheet, debt burden, and cash flow, which aren't reflected in the PEG ratio or other valuation metrics that use the income statement.
Related investing topics
The bottom line
The PEG ratio is a good way to value a stock while taking its growth rate into account, and investors should be familiar with how the PEG ratio formula works. However, there are drawbacks to using the metric. Like any of the popular valuation ratios, it shouldn't be used as a one-off test to decide whether to buy a stock or not. It's important to understand things like a company's competitive advantage, its addressable market, and its long-term growth prospects.
Traditionally, a PEG of 1 was seen as the market average, but that is no longer true as stocks have gotten more expensive over the past decade with the high-priced, fast-growing tech sector coming to dominate the market. That may be one reason why the PEG ratio is used less than the P/E, even though the PEG in many ways is more useful.
Investors who understand the PEG ratio and deploy it in their analysis can use it to their advantage. In particular, the PEG is a good tool for comparing stocks to competitors as well as to their historical valuation.