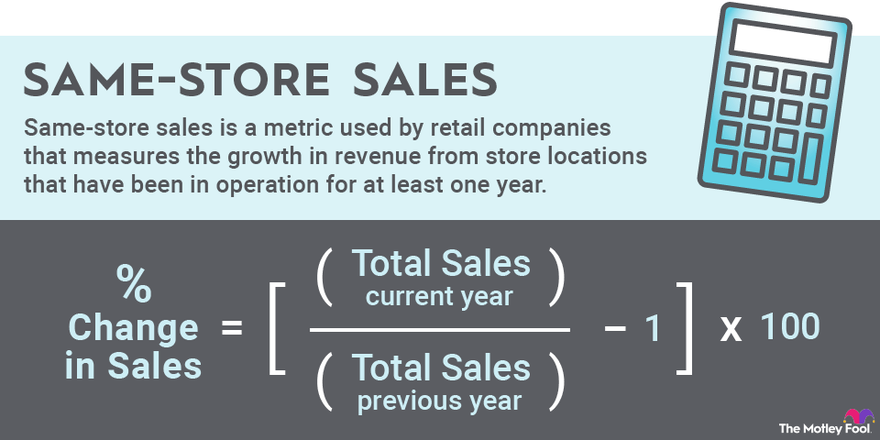
Same-store sales is a metric used by retail companies that measures the growth in revenue from store locations that have been in operation for at least one year. Sometimes called comparable-store sales, it’s an important metric to gauge organic growth from existing stores versus growth through store expansion. Investors ideally want to see improvements in both.
Investors in retail stocks should know how a company reports same-store sales, what it means for shareholders, and why analysts pay close attention to the metric. Read on to learn more.
Understanding same-store sales
Same-store sales can tell us how much of a retailer’s sales growth is organic and driven by factors at the store level. That growth could be due to increased foot traffic, increased average basket price, or a combination of those.
Same-store sales growth is a simple number for a retailer to calculate. Revenue is taken for a given period, usually a quarter or a year, and sales are subtracted from stores operating for fewer than 12 months. Sales are then taken from the prior-year period and revenue generated by stores it no longer operates is subtracted. Dividing the first number by the second gives the same-store sales growth.
The number is expressed as a percentage growth rate. So if a retailer’s stores generated $1 billion in sales last year, and those same stores generated $1.05 billion this year, same-store sales growth was 5%.
Why same-store sales are important
Strong same-store sales are a sign of a healthy business. If a business is expanding to new locations, but its same-store sales are declining, it may be operating inefficiently. New locations could be cannibalizing old ones. The money spent on new locations may be better spent on improving operations in existing stores.
If same-store sales are consistently declining, it tells investors that the business has limited growth potential. You can only open so many new locations before the market is saturated. If each store can keep increasing sales year after year, the potential for revenue is unlimited.
Ultimately, strong same-store sales growth is an indicator of strong operational performance. It indicates management’s ability to generate strong return on assets by using existing store properties to sell more inventory.
Management can use same-store sales to identify underperforming locations. It can then make decisions about how to improve sales at those stores or if it needs to close those stores.
Management can also use same-store sales to identify the impact of competitors opening locations near its existing stores. If a store goes from expanding sales at above-average rates to below-average levels after a competitor moves in down the street, it’s an indication that it’s seeing a significant impact. Likewise, management may also be able to tell if its new stores are cannibalizing older stores.
Same-store sales may also be analyzed in the context of overall consumer spending. If consumers are spending more across both consumer staples and discretionary purchases, investors should expect to see same-store sales keep pace with the rest of the industry a retailer operates in.
Example of same-store sales
Target (TGT -1.45%) provides its investors with a breakdown of its same-store sales in each earnings report, including the impact of its growing e-commerce operations on the metric.
Here’s what the company wrote in its full-year 2021 earnings release: “Full-year sales increased 13.2 percent to $104.6 billion from $92.4 billion last year, reflecting a 12.7 percent increase in comparable sales combined with sales from non-mature stores.”
As you can see, the bulk of Target’s revenue growth came from improving sales at its existing stores. New stores, or “non-mature stores,” produced a 0.5% uplift in sales for the year.
For reference, Target opened 29 net new stores in 2021, an increase of about 1.5%. Not all of those stores were at full operations for the entire year, so their contribution to sales growth ought to be less than 1.5%.
Target further breaks down how it increased same-store sales. The company saw a 12.3% increase in total transactions and a 0.4% increase in the amount shoppers spent per transaction. Target drove revenue by getting more people to shop at its stores in 2021 than in 2020.
However, considering the rate of inflation, it appears shoppers spent less in real dollars per trip than they did in 2020. Should investors be concerned about that? 2020 was an interesting year, to say the least, and most shoppers tried to make as few trips to the store as possible. Therefore, fewer trips with larger baskets made sense for 2020, and that trend reversed in 2021. Target’s same-store sales growth still handily beat the rate of inflation.
Target also breaks out the impact of digital sales on its comparable-store sales metric. When removing the impact of 20.8% growth in digital sales, same-store sales increased 11% in 2021. That’s another great insight into how well the physical stores are performing.
Related investing topics
The bottom line on same-store sales
Understanding same-store sales and how this metric is impacted by various factors is important when analyzing any retail company. If a retailer is expanding to new locations while same-store sales growth is declining, a prospective investor needs to do some deeper analysis. It may be a short-term blip, or it may be a warning sign to stay away from the investment.
A company producing consistently strong same-store sales growth has much more potential for long-term growth and improved profitability than a store that’s only able to grow by expanding to new locations. Investors will want to find the former and avoid the latter as they research retail stocks.