A benchmark is a standard used for comparison and assessment. Benchmarks help investors evaluate a security's performance and risk profile. Below, you'll learn more about investing benchmarks, meet a few common ones, and discover how to use them to improve your investing strategy.

What are benchmarks?
Understanding benchmarks
Investing benchmarks are indexes like the S&P 500 or the Wilshire 5000. An index includes a collection of assets that depicts a specific market segment. The S&P 500, for example, represents the largest and most successful public companies in the U.S. The Wilshire 5000 takes a broader view, functioning as a measure of the entire U.S. stock market.
Exchange-Traded Fund (ETF)
Benchmark indexes show investors how market segments are performing or have performed historically. Because the financial markets are inherently volatile, that context is critical when evaluating specific assets or asset types.
For example, say you own a mature, large-cap stock that appreciates 5% in 12 months. It's hard to say whether that's good or bad without reviewing similar assets' performances over the same time frame. If the S&P 500 rose 20%, the stock underperformed; if the S&P fell 20%, it was a rock star.
Obviously, much more goes into your analysis. However, those quick assessments would be challenging without the benchmark as a point of comparison.
Common benchmarks
Common benchmarks
Benchmarks come in all shapes and sizes. They can be broad, like the Wilshire 5000, or small, like the Dow Jones Industrial Average, which comprises only 30 stocks. They can also focus on a specific asset class, company size, geography, market segment, or investing strategy. Five common investing benchmarks are outlined below.
S&P 500
The S&P 500 may be the most referenced benchmark index in the U.S. Typically, you'd look to the S&P 500 if you wanted to know how the stock market as a whole is performing. The index includes 500 of the most established and successful large-cap U.S. stocks.
Nasdaq Composite Index
The Nasdaq Composite Index includes 2,500-plus stocks listed on the Nasdaq stock exchange. More than 55% of Nasdaq companies are technology stocks, including Apple (NASDAQ:APPL), Microsoft (MSFT -1.96%), and Amazon (AMZN -1.35%). This index is primarily a gauge of how big tech stocks are performing.
MSCI World Index
The MSCI World Index tracks 1,510 large-cap and mid-cap companies in various developed markets. The U.S. is the most heavily represented country, followed by Japan and the United Kingdom.
MSCI Emerging Markets Index
The MSCI Emerging Markets Index includes more than 1,400 large- and mid-cap stocks in emerging market countries. Emerging markets can experience fast growth as they transition to more established economies. As the historic performance of this index shows, however, these stocks can also be very volatile.
Bloomberg Barclays U.S. Aggregate Bond Index
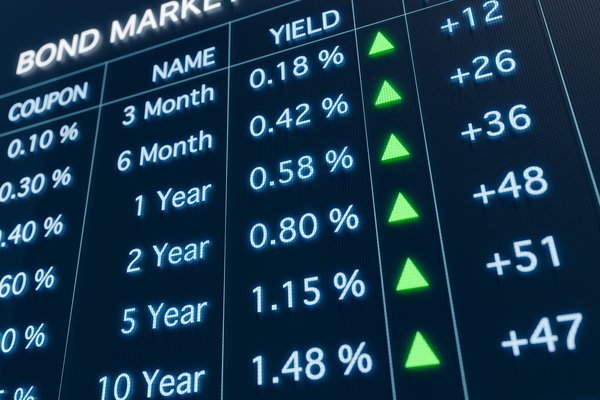
The Bloomberg Barclays U.S. Aggregate Bond Index measures the performance of the U.S. investment-grade bond market. The index includes various investment-grade bonds, including Treasuries, municipal bonds, corporate bonds, and mortgage-backed securities.
Using benchmarks
How to use benchmarks
You can use benchmarks to evaluate specific stocks and funds, market segments, and asset allocations.
Stocks and funds
You can compare a stock's or fund's performance to one or more benchmarks representing the asset's peer groups. If it's a start-up biotech company, for example, you'd look at small-cap and biotech indexes. If you're analyzing a mid-cap growth fund, you'd find a mid-cap growth index. Benchmarking is often easier with a fund because funds will publish benchmark returns along with the fund's performance.
Market segments
A benchmark can quickly tell you how a specific market segment performs. Wondering how volatile bitcoin really is? Check the five-year chart for the S&P Bitcoin Index. Thinking about getting into investing in real estate investment trusts (REITs)? See the FTSE Nareit Equity REITs Index.
Asset allocations
Broad indexes that include different asset classes and types can demonstrate how specific asset allocations behave over time. You could also use weighted averages of focused indexes to assess new asset allocations.
Benchmarking Spotlight
Fund Benchmarking Spotlight: VSCGX
Vanguard LifeStrategy Conservative Growth Fund (VSCGX -0.44%) is an all-in-one portfolio that looks to provide income first and capital appreciation second. The holdings in Vanguard's LifeStrategy Conservative Growth Fund are index funds combined in a conservative allocation.
According to fund documentation, this benchmark is a composite of indexes as follows:
- Bloomberg U.S. Aggregate Float Adjusted Index: 42%
- CRSP U.S. Total Market Index: 24%
- Bloomberg Aggregate ex-USD Float Adjusted RIC Capped Index: 18%
- FTSE Global All Cap ex U.S. Index: 16%
Unsurprisingly, this Vanguard fund's allocation aligns exactly with the composite. Vanguard's LifeStrategy Conservative Growth Fund has about 42% in a U.S. bond fund, 24% in U.S. stocks, 18% in an international bond fund, and 16% in international stocks.
Related investing topics
Over the past decade, the fund has returned an average of 4.25% annually. The benchmark return is slightly higher at 4.54%. A small underperformance to the benchmark is typical for funds. Funds, unlike indexes, have fees and timing issues related to trades.
Since the fund's inception in 1994, it has had the same average annual return as the index: 6.17%. The fund's 4% to 6% return over time is modest relative to an all-stock benchmark like the S&P 500. This is what you'd expect from a conservative fund. If you wanted higher returns, you'd seek out a fund with more exposure to stocks than bonds.