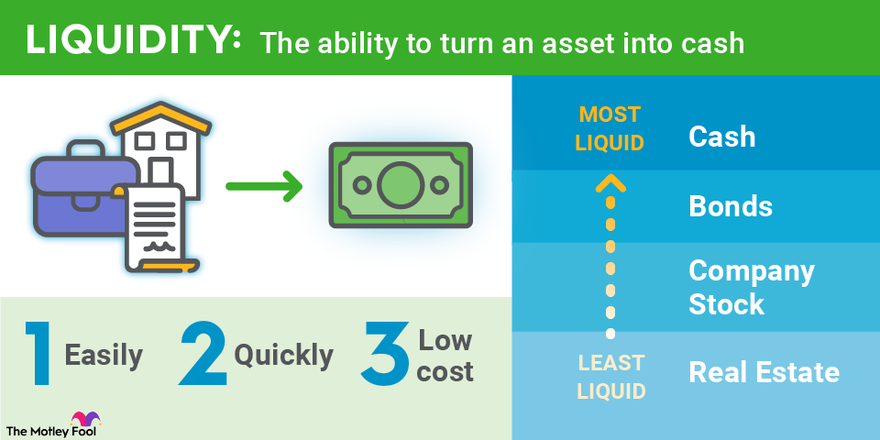
An asset is considered liquid if it can be bought or sold quickly without affecting its price. An asset that can be sold rapidly for its full value is said to be highly liquid. An asset that takes significant time to sell, or one that can only be sold at a discounted value, is considered less liquid or illiquid.
Market liquidity and accounting liquidity are two related terms that refer to different concepts. Market liquidity is how easily a stock trades in the public markets, while accounting liquidity refers to a company's ability to pay its short-term obligations.
Both types of liquidity can be relevant to you as an investor, but a stock's market liquidity is generally what is implied when investors discuss liquidity. Keep reading to learn everything you need to know about liquidity.
Understanding market liquidity
Understanding market liquidity
A stock with market liquidity is readily available for purchase or sale. Another way to gauge a stock's market liquidity is to examine the difference between the asking price and the ultimate sale price -- also known as the bid-ask spread. If the price difference is insignificant, then the market for the stock is said to be fairly liquid.
Trading volume is another important indicator of stock liquidity. A stock that trades heavily has greater market liquidity. Stocks with high trading volumes are typically the easiest to sell.
Volume in Stocks
Are stocks liquid assets?
Are stocks liquid assets?
Many segments of the stock market, like the market for large-cap stocks, are considered to be highly liquid. This is for a variety of reasons, including:
- High trading volumes
- Relatively tight bid-ask spreads
- Fast trade execution
Among the large-cap universe of stocks are many household names known for high liquidity. Apple (AAPL -2.19%), Tesla (TSLA -5.59%), and Facebook (NASDAQ:FB) are all great examples of highly liquid stocks.
Penny stocks, which are stocks that trade for $5 or less, are known to be relatively illiquid. Penny stocks tend to be thinly traded, have wide bid-ask spreads, and may be slow to sell -- particularly if you're trying to unload a large number of shares.
How to determine a stock's liquidity
How to determine a stock's liquidity
Analyzing a stock's liquidity is as much qualitative as it is quantitative. Your main considerations are:
- How narrow is the bid-ask spread?
- What is the average daily trading volume?
Using Starbucks (SBUX 0.29%) as an example, at the time of this writing, the bid-ask spread is a penny: $112.46-$112.47. This is an indication that the stock is extremely liquid, and a trade of any reasonable size does not impact the price.
Trading volume of at least 1 million shares daily is considered a sign of market liquidity. Starbucks' average trading volume during the past three months has been just over 6.5 million -- another sign that the market for Starbucks shares is highly liquid. Unless you're trading a sizable number of shares (in the hundreds of thousands), you can consider Starbucks stock to be liquid.
Examples of liquid stocks
Examples of liquid stocks
Below is a table of the 10 most liquid stocks, based on the average traded dollar volume:
| Company | 2021 Average Dollar Volume Traded |
|---|---|
| Tesla, Inc. (NASDAQ:TSLA) | $314.7 billion |
| Amazon.com, Inc. (NASDAQ:AMZN) | $208.7 billion |
| Apple, Inc. (NASDAQ:AAPL) | $179.1 billion |
| Microsoft Corporation (NASDAQ:MSFT) | $103.1 billion |
| Facebook, Inc. (NASDAQ:FB) | $95.0 billion |
| NVIDIA Corporation (NASDAQ:NVDA) | $77.6 billion |
| Alphabet, Inc. Class A (NASDAQ:GOOGL) | $58.2 billion |
| Advanced Micro Devices, Inc. (NASDAQ:AMD) | $57.0 billion |
| Alphabet, Inc. Class C (NASDAQ:GOOG) | $48.7 billion |
| Micron Technology, Inc. (NASDAQ:MU) | $24.1 billion |
What is accounting liquidity?
What is accounting liquidity?
Accounting liquidity denotes the degree to which a company is able to pay its short-term obligations. (Short-term, in this context, is widely understood to mean 12 months.) Accounting liquidity is calculated by analyzing a company's financial statements, and typically the following metrics are calculated:
- Current ratio: The current ratio is found by simply dividing a company's current assets by its current liabilities. Current assets include cash and other assets the company expects to use or consume within a year, while current liabilities are the company's debts due within the next 12 months.
- Quick ratio: To calculate a company's quick ratio, add cash, marketable securities, and accounts receivable, and divide that sum by the company's current liabilities. This measure is used to determine the degree to which a company can quickly settle its current debts using only its quickly accessible assets.
- Acid-test ratio: The acid-test ratio is another way to measure a company's ability to quickly pay off its debts and is often calculated the same as the quick ratio. In another variation of the acid-test ratio, subtract the value of a company's inventory from its current assets and divide that amount by the company's current liabilities.
- Cash ratio: The cash ratio is simply a company's cash balance divided by its current liabilities.
Related investing topics
Why liquidity matters
Why liquidity matters
A stock's liquidity is mainly important because it indicates how easily investors can exit a position, while accounting liquidity helps investors gain a better sense of a company's financial flexibility.
Understanding the liquidity of your portfolio is a key component of risk management. If you can easily convert your stock holdings into cash, then you can settle unexpected expenses, even if the stock market broadly declines.