Study: The Most Socially Equitable Cities in the U.S.
For the past decade, social equity has been in the spotlight. Black Lives Matter, Me Too, strong pushes for environmental protection, and other movements geared toward advancing equity are in the news almost daily.
Some cities, however, are doing better than others when it comes to promoting social equity. The Ascent wanted to find out which cities are walking the walk when it comes to socially responsible values. So we looked at thirteen data points in six categories to find out.
What is social equity?
PolicyLink, a research and action non-profit that advances economic and social equity, defines equity as "just and fair inclusion into a society in which all can participate, prosper, and reach their full potential."
The American Planning Association, which helps planners prepare communities for change, explains that "social equity means recognizing planning practices that have had a disparate impact on certain communities and actively working with affected residents to create better communities for all."
Dr. Rashmi Chordiya, assistant professor at Seattle University, adds detail: "Socially conscious cities and communities are adept and agile in progressing towards disrupting and dismantling oppressive systems while re-designing, rebuilding, and re-aligning systems to be firmly rooted in anti-racist, socially just, liberatory practices that lift-up and center the most vulnerable communities."
"A socially conscious city," Chordiya continues, "operationalizes and integrates values of justice, equity, diversity, and inclusion (JEDI) within its policies, programs, practices, and processes. It does not separate climate justice from social justice. Instead of using the dominant, binary way of thinking in an either/or way (e.g., good and bad), socially conscious cities and communities dare to take a bold, complex both/and approach to creative and collaborative problem solving and conflict transformation."
The 10 most socially equitable U.S. cities
Using six metrics (equality, neighborliness, labor and pay, sustainability, public transit, and healthcare cost), we’ve identified the 10 most socially equitable cities in the United States. These cities provide examples for others to follow -- but even the best cities have room to improve.
Here are the category and overall scores for the top 10 cities. We'll start with No. 10 and work our way down to the most socially equitable city in the country at No. 1.
10. Madison, Wisconsin

Image source: Getty Images.
Buoyed by strong sheltered homelessness, LGBTQ equality, gender pay equality, crime, and sustainability scores, Madison did well enough to make the top ten. Its racial equality and immigrant friendliness scores are mediocre, and minimum wage, which rests at the federal level of $7.25, acts as a drag on its overall ranking.
9. San Jose, California
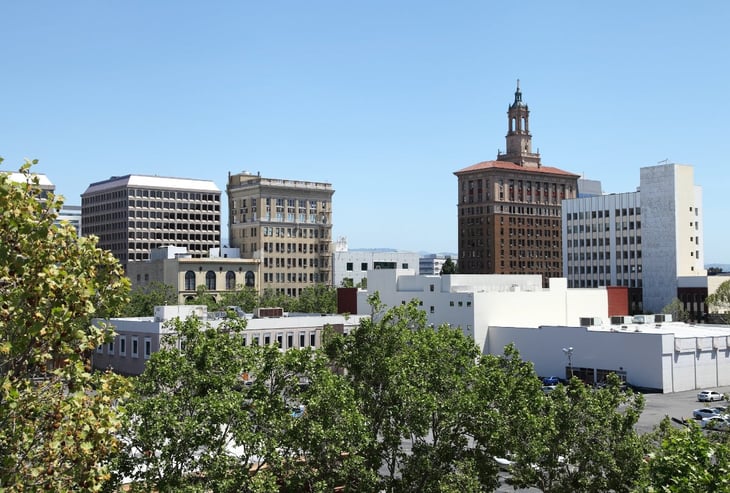
Image source: Getty Images.
San Jose continues our top ten list with the best healthcare cost score in our overall rankings, plus standout sustainability and labor and pay scores. Its equality scores are also solid, but the city is dragged down by its sheltered homeless score, which is the worst in our overall rankings.
8. Jersey City, New Jersey

Image source: Getty Images
On the eastern bank of the Hudson River, Jersey City posts exceptional scores in LGBTQ equality, gender pay equality, and immigrant welcomeness. Its public transit score is among the best in our overall rankings.
However, Jersey City's racial equality score is near the bottom of our list.
7. Boston, Massachusetts

Image source: Getty Images.
Boston stands out for its strong neighborliness score, including the top sheltered homelessness score among all cities we ranked, a solid sustainability score, and among the highest public transit scores.
It struggles with healthcare costs and has among the lowest racial equality scores on our overall list. Its childcare cost and broadband connectivity scores are also sub-par.
6. New York, New York
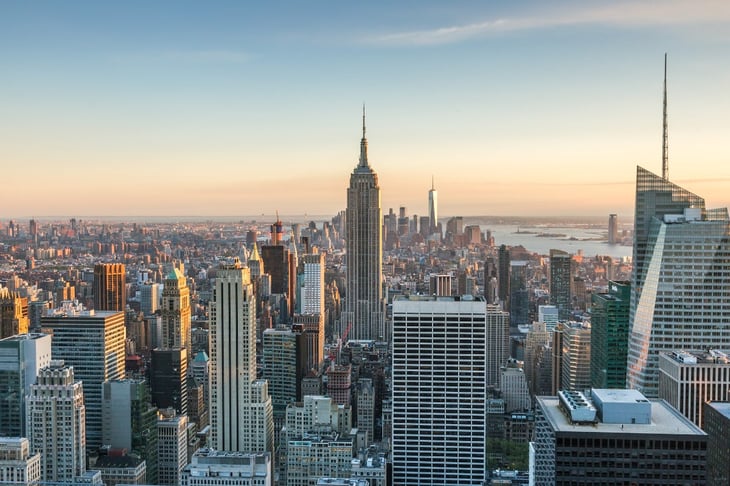
Image source: Getty Images
New York posted the highest public transit score and strong scores in gender pay equality, LGBTQ equality, crime, immigrant friendliness, labor protection, and minimum wage. The city has one of the largest subway systems in the world, and utilizes buses, ferries, trams, and commuter trains to connect the 8.4 million people living in New York to all five boroughs. The subway alone had an average daily ridership of 5.5 million in 2019.
NYC was kept out of the top five with one of the lowest racial equality scores and struggles with sheltered homeless, broadband connectivity, childcare costs, sustainability, and healthcare costs.
5. Washington, District of Columbia
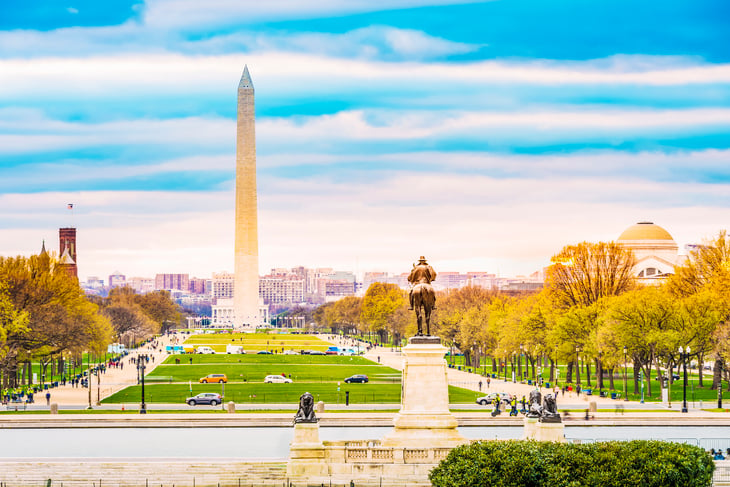
Image source: Getty Images.
The nation’s capital does well in gender pay equality, LGBTQ equality, labor protections, sustainability, and minimum wage, and has among the highest transit scores.
However, racial equality, crime, and healthcare costs are near the bottom of our overall rankings, and D.C. struggles with broadband connectivity and homelessness. Its crime scores are middling as well.
4. Portland, Oregon
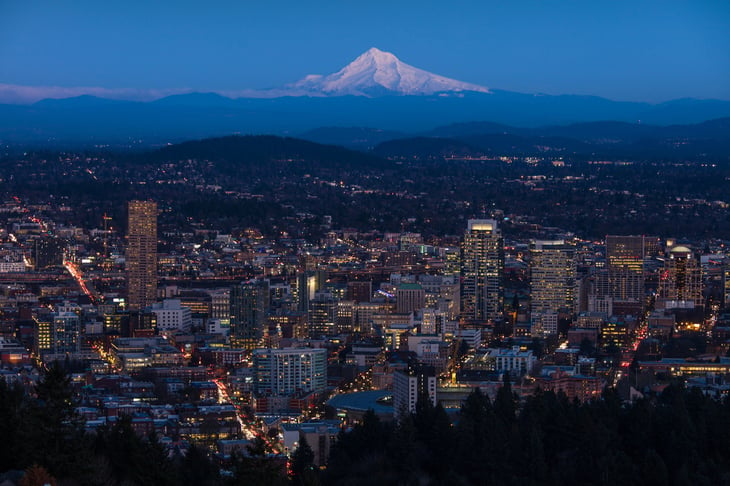
Image source: Getty Images.
Portland does well in LGBTQ equality and labor protection and is near the top of our rankings in sustainability and public transit.
Portland's emissions in 2018–2019 were 41% lower than they were in 2007–2008 and it's on track to meet its longer-term sustainability goals in part due to investments in local renewable energy projects.
3. Chula Vista, California
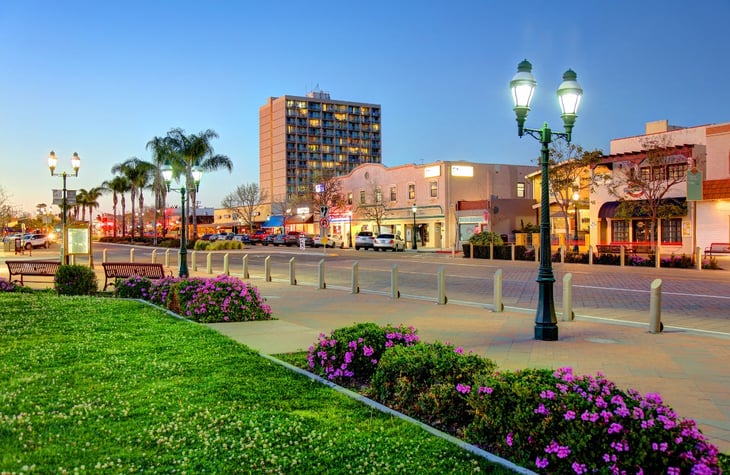
Image source: Getty Images.
Located between San Diego and the U.S.-Mexico border, Chula Vista posted the best scores in immigrant friendliness. Unsurprisingly, Chula Vista became the first city in California to receive certification as a "Welcoming City'' by the non-profit group Welcoming America. About one-third of Chula Vista’s residents are foreign-born, per Census data.
Chula Vista, however, struggles with sheltering its homeless population -- its score in that category is well below average among the cities we measured. Its public transit and broadband scores are also mediocre.
2. Seattle, Washington
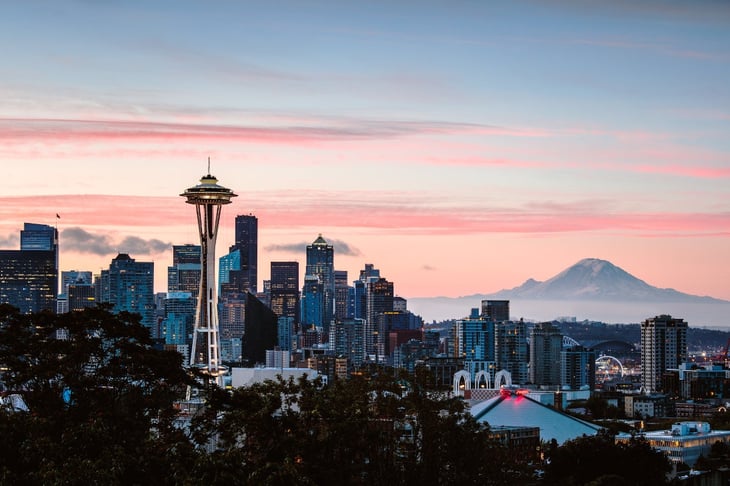
Image source: Getty Images.
Seattle boasts the highest minimum wage in the country ($16.69 per hour), a strong labor score, and is among the best cities in terms of sustainability. We asked Mark Hallenbeck, Director of the Washington State Transportation Center at the University of Washington, about the public transit in Seattle.
"e were pioneers in the deployment of HOV lanes (on which our heavily used commuter oriented transit service is heavily reliant), and park and rides, and with employers working with the transit agencies to design services that met their needs (we have the largest vanpooling network in the country), and employer based commute trip incentive programs to encourage people to use modes other than driving alone," says Hallenbeck.
"You need a mix of land use and transportation decisions working in concert. While not perfect at that, we are doing a far better job of it than most American cities."
Seattle's public transit system is a great strength, but its middling-to-poor racial equality, gender pay equality, childcare, crime, and sheltered homeless scores kept it out of the top spot this year.
1. San Francisco, California
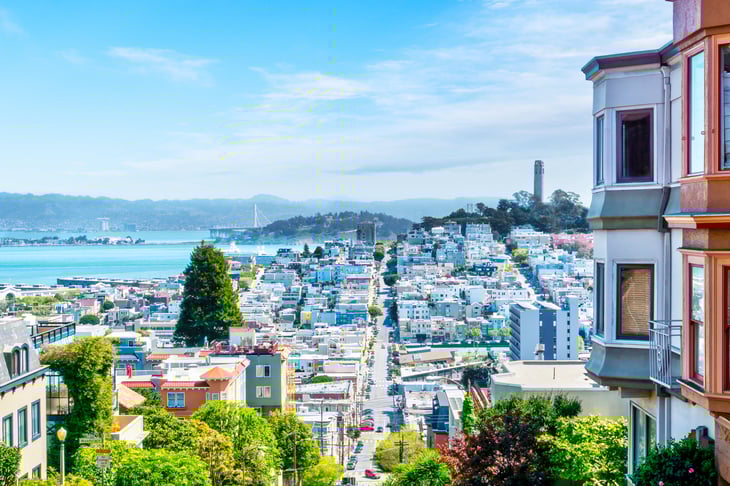
Image source: Getty Images
The top city on our list was able to take advantage of the strengths of other cities in California -- strong scores in LGBTQ equality, labor protections, and immigrant friendliness -- while setting itself apart with one of the highest minimum wages in the country and a perfect sustainability score.
Unfortunately, San Francisco posts the worst crime score in our top ten list, and is toward the bottom of our overall crime rankings. It also struggles with racial equality, broadband connectivity, and sheltering the homeless.
Honorable mentions
Las Vegas, Nevada
America’s playground boasts the highest equality scores in our rankings, buoyed by a perfect LGBTQ equality score, a top five gender pay equality score, and the third-highest racial equality score.
Las Vegas also scored respectably in neighborliness and its middling scores for labor and pay as well as sustainability were good for it to come in at No. 35 on our overall list.
Durham, North Carolina
While 55th on our national list, Durham posted the highest gender pay equity score of all the cities we reviewed. Durham County was the first country in North Carolina to pass the Convention on the Elimination of All Forms of Discrimination Against Women -- the United States is one of the few countries in the world that has not signed and ratified the convention -- and Durham was the first city in North Caroline to ratify it.
Women in Durham also earn more than men in a variety of occupations, such as computer and mathematical occupations, legal occupations, law enforcement, personal care and services, office and administrative support, installation, maintenance, and repair occupations, and material moving occupations.
Oakland, California
Oakland has the second-highest healthcare affordability score on our list, and unsurprisingly it's close geographically and in terms of score to San Jose, the top healthcare cost scorer, and San Francisco, with which it's tied.
Overall, Oakland ranked 17th on our list, sharing strong equality and labor and pay scores with the other California cities in our rankings and a decent public transportation score. It was pulled down by crime and homelessness scores in the bottom five of our rankings and a below-average racial equity score.
Buffalo, New York
Buffalo’s honorable mention is a result of its sheltered homelessness score, which is good for second behind Boston in our rankings. Buffalo ranked 23rd overall, with strong gender pay and LGBTQ equality scores and solid labor protection and public transit scores.
Its racial equality score, unfortunately, was in the bottom-ten on our list, and it has work to do when it comes to sustainability, broadband, and the affordability of childcare.
Full social equity rankings
Want to see where your city ranks in The Ascent's list of the most socially equitable cities? Here's the full data.
Keep in mind that we've only included cities that are missing, at most, two pieces of data. We've excluded the rest to prevent unfair comparison with cities that have more data points.
Most socially equitable cities in the U.S.
The Ascent used six factors composed of 13 data points to estimate the social equity of 75 cities around the United States. Here are all of their category and total scores:
In search of the socially equitable city
Is it realistic to expect a perfect score from any city? Probably not. Even if we did have cities with perfect scores, they wouldn’t be paragons of social equity. The ways that researchers capture things like racial equality and food access are imperfect. Still, if you live in one of these cities, you’ll probably find some truth in their scores.
However, we can take steps in the right direction.
According to Dr. Chordiya, "To transform our cities into socially conscious ones, we need to care enough to commit to transform "our"-selves. It means to unlearn oppressive practices rooted in domination or power over others, and to learn and practice behaviors and investments rooted in solidarity and accountability towards those who are socially marginalized. It means we stay committed to the inner and collective change process."
Further, she says, "The collective change may begin to happen in small groups of two or three people. This is important to note. We do not need big groups of hundreds of people, two or three people are enough to begin collective change work. This change work must not be done with an attitude of charity, it must be truly in service of freedom and liberation, in service of justice, equity, diversity, and inclusion (JEDI), in service of repair and healing within our cities, and in our communities."
"At its core, social justice work is healing work. In a society where trauma is pervasive, we need to heal first to be helpful."
Dr. Rachel Brahinsky, Associate Professor of Politics & Urban Studies at the University of San Francisco, provides similar advice:
"Historically, cities have become more socially equitable when strong grassroots social movements push for policies and practices that better distribute access to essential resources like well-funded education, clean water and air, solid and affordable housing, and more."
"Frederick Douglass noted back in the 1850s," Brahinsky continues, "that 'power concedes nothing without a demand,' and this maxim remains true in the contemporary urban context. Essentially, cities become more equitable when they are forced to be -- by movements that represent, and often spring from, marginalized groups."
Methodology
To get a rough measure of each city's social equity, we used the sum of seven factors. Each factor, detailed below, was transformed into a rating between zero and 100. In most cases, the highest value on any scale was converted to 100, while the lowest was converted to zero (in some cases, such as healthcare cost, the opposite is true).
Then we totaled each city's scores to get their final score out of 700.
Unfortunately, not every city had data points for every factor. If a city was missing more than two data points, we left it out of the ranking. We know this isn't totally fair to every city, but we also didn't want to use the average score and let some cities slide by on one or two really high numbers. In the end, this seemed like the most balanced way to deal with cities that didn't show up in all of the datasets we referenced.
Here's how we calculated each factor:
Equality
To develop our equality score, we used three sources: Governing.com’s black-white dissimilarity index, the 2019 American Community Survey’s gender pay gap (table S2411), and the Human Rights Campaign’s Municipal Equality Index. We averaged the transformed values of all three to create the equality score for each city.
The black-white dissimilarity index looks at "how evenly distributed demographic groups are throughout a larger area." While some cities might be more accurately classified by other racial comparisons, this was the most available statistic for racial equality in large cities.
The Human Rights Campaign’s Municipal Equality Index measures LGBTQ inclusivity based on "non-discrimination laws, the municipality as an employer, municipal services, law enforcement, and the city leadership's public position on equality."
The Census Bureau's American Community Survey shows women’s pay as a percentage of men’s at multiple levels, including metro areas.
Neighborliness
We used three sources to develop our neighborliness score: crime rate, proportion of homeless who are sheltered, and immigrant friendliness. After transforming each item into a 0-100 value, we averaged all three to get the neighborliness score.
To measure crime rates, we used the FBI’s 2019 Crime in the United States report. Ranking cities by crime rate is a fraught practice; the FBI cautions against using its data to rank locales because factors as diverse as population density, youth population, climate, crime reporting practices, economic conditions, modes of transportation, and cultural and religious factors can affect crime statistics. By combining this measure with three others to produce our neighborliness score, we de-emphasize its importance in our ratings while still acknowledging that crime matters.
The proportion of the homeless population that is sheltered comes from the U.S. Department of Housing and Urban Development, which conducts a point-in-time count of homeless individuals on one night every January. We used the most recent results from the January 2020 survey.
Unsheltered homelessness has risen over the last five years as the number of emergency beds and transitional housing units has declined. More than half a million Americans were homeless in 2020, and 39% were unsheltered, meaning they were staying on the street, in abandoned buildings, or in similarly inhospitable places. Despite making up just 13% of the U.S. population, 39% of the homeless population is African American.
We used the New American Economy (NAE) Cities Index to measure a city’s friendliness to immigrants. The Index looks at numerous factors in each city that affect immigrants, such as language support, immigrant-focused government and community services, and anti-wage-theft laws, along with the median income immigrants earn, their naturalization rate, and much more.
Labor and pay
The labor and pay score was constructed from four sources: labor protections, the cost of childcare, minimum wage, and broadband connectivity.
Oxfam measures labor protections on a state level by scoring three policy areas: wages, worker protections, and the right to organize. The data was last updated August 31, 2020.
The Economic Policy Institute (EPI) measures the income a family needs to attain a modest standard of living. One measure in its Family Budget Calculator, published in March 2018 and based on 2016 data, is the cost of child care for a two-child family.
It assumes that one child is four years old and needs full-time, year-round care; and the other child is eight years old and needs nine months of before- and after-school care and two months of full-time summer care. EPI also assumes the family uses center-based rather than home-based care.
The Economic Policy Institute also tracks city and state minimum wages.
Connection to broadband -- reliable, high-speed internet that enables the use of websites, apps, video calls, online education platforms, and so on -- is an important part of the lives of Americans, including as a means to find employment and increasingly do their jobs from home. Microsoft has collected county-level data on the percentage of residents that use broadband speed internet, which we mapped onto cities.
Sustainability
The 2019 U.S. Cities Sustainable Development Report ranks 105 U.S. cities on their progress toward meeting each of the UN’s 17 Sustainable Development Goals for 2030. The score ranks 57 indicators per city that contribute to goals such as clean water and sanitation, affordable and clean energy, and zero hunger.
Public transit
To score cities on public transit, we used the AllTransit Performance Score, which looks at availability and frequency of service, connectivity to jobs, coverage area, and the percent of commuters who take transit to work. The Center for Neighborhood Technology assembles and analyzes this data.
Healthcare cost
The Robert Wood Johnson Foundation’s Healthy Marketplace Index provides the basis for our healthcare cost scores. This index is based on an analysis of 1.8 billion health care claims from 2013 through 2017 for individuals with commercial health insurance.
Sources
- Center for Neighborhood Technology (2019). AllTransit Rankings.
- City of Chula Vista. Welcoming City.
- Economic Policy Institute (2018). Family Budget Calculator.
- Economic Policy Institute (2021). Minimum Wage Tracker.
- Federal Bureau of Investigation (2020). Crime in the United States: Offense data by city agency.
- Governing.com (2019). Residential Segregation Data for US Metro Areas.
- Health Care Cost Institute (2021). Healthy Marketplace Index Interactive Report
- Human Rights Campaign (2020). Municipal Equality Index.
- Metropolitan Transit Authority (2020). Subway and bus ridership for 2019.
- Microsoft (2021). United States Broadband Usage Percentages Dataset.
- Oxfam (2020). The Best and Worst States to Work in America 2020.
- Sustainable Development Solutions Network (2019). The 2019 US Cities Sustainable Development Report.
- U.S. Census Bureau (2019). American Community Survey: Table S2411: Occupation by Sex and Median Earnings in the Past 12 Months.
- U.S. Department of Housing and Urban Development (2020). 2020 AHR: Part 1 - PIT Estimates of Homelessness in the U.S.
Our Research Expert
Jack Caporal is the Research Director for The Motley Fool and The Motley Fool Ascent.
We're firm believers in the Golden Rule, which is why editorial opinions are ours alone and have not been previously reviewed, approved, or endorsed by included advertisers. The Ascent does not cover all offers on the market. Editorial content from The Ascent is separate from The Motley Fool editorial content and is created by a different analyst team. The Motley Fool has a Disclosure Policy. The Author and/or The Motley Fool may have an interest in companies mentioned.