Study: Race and Personal Finance in America
KEY POINTS
- Net worth by race: White families had median net worth of $284,310 in 2022. Hispanic families had a median net worth of $62,120 and Black families had a median net worth of $44,100, according to the Federal Reserve.
- Saving rates: People of color are more likely than white Americans to save over 10% of their income every month.
- Financial worry scores: White Americans carry the most financial worry, with an average score of 3.6. People of color have a financial worry score of 3.4, with Latin Americans holding the least financial worry.
For as long as organizations have tracked the wealth of different racial and ethnic groups, the net worth of white Americans has far outpaced that of people of color. Wealth inequality in America is a serious issue.
It raises the question of how much race factors into a person's financial habits and opportunities.
To find out, we conducted a survey to analyze the similarities and differences not just between white and Black Americans, but of all the major ethnic groups within the United States.
Here's what we found.
(Editor's note: "people of color," in this case, refers to all non-white racial and ethnic groups as a whole.)
Jump To
- Savings rate by race and ethnicity
- Emergency savings by race and ethnicity
- Employment rate by race and ethnicity
- Checking and saving account ownership rate by race/ethnicity
- Non-retirement investment account ownership rate by race and ethnicity
- Primary investment priority by race and ethnicity
- Retirement account ownership rate by race and ethnicity
- Certificate of deposit ownership rate by race and ethnicity
- Budgeting habits by race and ethnicity
- Sources of financial advice and information by race and ethnicity
- Race and personal finance in America
- Sources
- Methodology
Net worth by race and ethnicity
Over the past 30 years, the net worth of white families has been over $100,000 greater than that of Black and Hispanic families, according to data collected by the Federal Reserve.
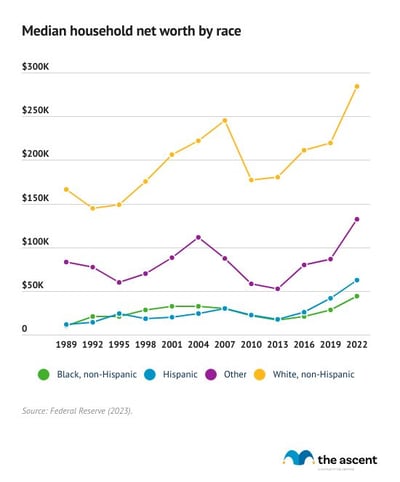
In 2022, white families had a median net worth of $284,310 compared to $62,120 for Hispanic families, $44,100 for Black families, and $132,200 for families of another race.
| Race | 2022 |
|---|---|
| Black, non-Hispanic | $44,100 |
| Hispanic | $62,120 |
| Other | $132,200 |
| White, non-Hispanic | $284,310 |
While new research shows that the wealth gap between Black and white families has narrowed since the mid-1800s, progress has stalled and even reversed in recent years.
Why is that the case? While the income gap between Black and white Americans narrowed until the 1980s, the rate of growth in capital gains did not. White families hold more than twice as much of their wealth in equities as Black families and stock ownership is extremely concentrated towards white Americans, according to the Federal Reserve.
Savings rate by race and ethnicity
People of color are more likely than white Americans to save over 10% of their income every month. Fifty-one percent of people of color save more than 10% of their income each month, compared to 34% of white Americans.
Hispanic/Latino Americans are most likely to save over 10% of their income while white Americans are least likely.
What percentage of your income would you estimate that you save in an average month?
| Race/ethnicity | Up to 10% | Over 10% |
|---|---|---|
| Asian | 59% | 41% |
| Black | 52% | 49% |
| Hispanic/Latino | 40% | 60% |
| White | 66% | 34% |
| People of color | 49% | 51% |
| All respondents | 53% | 47% |
How much the average American should be saving each month is difficult to answer. Each person has a different financial situation that impacts their savings rate.
One rule of thumb is to have an emergency fund to cover at least three to six months of expenses in case of an emergency or unforeseen financial event.
Emergency savings by race and ethnicity
White Americans are less likely than people of color to have saved at least three months of expenses -- the minimum recommended amount to have in an emergency fund. Thirty-seven percent of white Americans have savings to cover three months of expenses, compared to 50% of people of color.
Hispanic/Latino Americans are most likely to have three months of savings (57%), which aligns with them being most likely to save over 10% of their paycheck each month.
Hispanic/Latino Americans are also the only group in which over 50% have three months of emergency savings. Asian, Black, and Hispanic Americans come close but just over half of those groups don't have savings to cover three months of expenses.
Do you have enough money in your savings account to cover three months' worth of expenses?
| Race/ethnicity | Percentage |
|---|---|
| Asian | 47% |
| Black | 44% |
| Hispanic/Latino | 57% |
| White | 37% |
| People of color | 50% |
| All respondents | 47% |
Income by race and ethnicity
Asian Americans have the highest median household income ($100,572) and are the only race/ethnicity to make over six figures on the median, according to Census Bureau data.
Asian Americans make about $25,000 more than white Americans, on median, and over double what Black Americans make.
Black households have the lowest median income ($46,774), followed by American Indian and Alaska Natives ($53,149).
| Race/ethnicity | Median household income |
|---|---|
| Asian | $100,572 |
| White alone, not Hispanic or Latino | $75,412 |
| White | $74,932 |
| Native Hawaiian and other Pacific Islander | $69,973 |
| Two or more races | $63,854 |
| Hispanic or Latino origin | $60,566 |
| Other | $57,671 |
| American Indian and Alaska Native | $53,149 |
| Black | $46,774 |
The income growth rate of Black and white Americans and therefore the wealth gap narrowed until the 1980s, at which point incomes for both groups have grown at about the same rate, according to the Federal Reserve.
Employment rate by race and ethnicity
Native Hawaiian and other Pacific Islander Americans have the highest labor force participation rate at 62%. Black and American Indian and Native Alaskan Americans have the lowest labor force participation rate at 56%.
| Race/ethnicity | Percent of population employed |
|---|---|
| Native Hawaiian and other Pacific Islander | 62% |
| Hispanic or Latino ethnicity | 61% |
| Asian | 61% |
| Two or more races | 60% |
| White | 59% |
| Black | 56% |
| American Indian and Alaska Native | 56% |
| All respondents | 58% |
White Americans carry the most financial worry
White Americans carry the most financial worry, with an average score of 3.6 out of 5, per The Motley Fool Ascent survey. People of color have a financial worry score of 3.3. A higher score indicates more financial stress.
Financial worry is based on how often respondents worry about their finances: all the time, most of the time, some of the time, rarely, and never.
Hispanic/Latino Americans hold the least financial worry, with an overall score of 3.2. Among those respondents, 18% said they worry about their finances all the time, the lowest percentage of any group.
Black Americans were least likely to say that they worry about their finances almost never (11%).
Overall, Americans had a financial worry score of 3.4 out of 5
| Race/ethnicity | Financial worry score |
|---|---|
| Asian | 3.4 |
| Black | 3.4 |
| Hispanic/Latino | 3.2 |
| White | 3.6 |
| People of color | 3.3 |
| All respondents | 3.4 |
Credit card ownership rate by race and ethnicity
White Americans have the highest credit card ownership rate, with 65% of white Americans holding at least one, according to The Motley Fool Ascent survey.
Hispanic/Latino Americans have the lowest credit card ownership rate at 59%.
| Race/ethnicity | Credit cards |
|---|---|
| Asian | 61% |
| Black | 60% |
| Hispanic/Latino | 59% |
| White | 65% |
| People of color | 60% |
| All respondents | 61% |
The data suggests that credit cards are fairly ubiquitous among Americans regardless of race, but credit card ownership doesn't tell the whole story.
Americans of color have a harder time getting the amount of credit they request and are more likely than white Americans to opt not to apply for credit because they assume they will be turned down. This can make it harder for people of color to build credit and get financing.
Other data shows that people of color are less likely than white Americans to have a credit card, but are more likely to carry revolving credit card debt.
Checking and saving account ownership rate by race/ethnicity
White Americans are most likely to have a checking account (88%) and savings account (75%). Hispanic/Latino Americans are least likely to have those accounts, which is notable given that their financial worry score is lowest among American adults.
Overall, Americans are more likely to have a checking account than a savings account, 74% to 64%.
The difference in the percentage of white Americans that have a checking account but not a savings account is greater than that of people of color.
| Race/ethnicity | Checking account | Savings account |
|---|---|---|
| Asian | 77% | 65% |
| Black | 75% | 65% |
| Hispanic/Latino | 60% | 50% |
| White | 88% | 75% |
| People of color | 70% | 61% |
| All respondents | 74% | 64% |
Each type of account comes with benefits.
A checking account is a safe place to store money for everyday use. Most are FDIC insured, too. The best checking accounts have minimal to no fees and a high APY to help account holders build wealth.
The best savings accounts can offer even higher interest rates in addition to being FDIC insured.
Non-retirement investment account ownership rate by race and ethnicity
People of color are more likely than white Americans to have a non-retirement investment account, like a brokerage account, led by Hispanic/Latino Americans, 13% of whom have a brokerage account, according to The Motley Fool Ascent survey.
Despite that, white Americans, of whom 8% have a brokerage account, still account for ownership of 89% of stocks.
| Race/ethnicity | Non-retirement investment account |
|---|---|
| Asian | 10% |
| Black | 8% |
| Hispanic/Latino | 13% |
| White | 8% |
| People of color | 11% |
| All respondents | 10% |
Investing patiently and over the long run is a great way to build wealth. The best brokers offer no-fee free trading and don't come with account minimums.
Primary investment priority by race and ethnicity
White Americans are most likely to be investing to save for retirement (46%), while people of color are most likely to be investing as part of their savings strategy or to build an emergency fund (33%).
Investing to build savings or an emergency fund is the most popular primary investment priority among all respondents, followed by saving for retirement.
What is your primary investment priority?
| Race/ethnicity | Saving for retirement | Securing my children's future | Saving for a downpayment on a house or car | Saving for a vacation | General saving / emergency fund | Other |
|---|---|---|---|---|---|---|
| Asian | 28% | 10% | 11% | 6% | 34% | 10% |
| Black | 19% | 15% | 11% | 11% | 41% | 4% |
| Hispanic/Latino | 21% | 12% | 15% | 11% | 29% | 13% |
| White | 46% | 11% | 6% | 5% | 31% | 2% |
| People of color | 23% | 12% | 12% | 9% | 33% | 10% |
| All respondents | 29% | 12% | 11% | 8% | 33% | 8% |
Retirement account ownership rate by race and ethnicity
White Americans are most likely to have a retirement account (62%), according to the Federal Reserve, while Hispanic Americans are least likely to have one (28%).
| Race/ethnicity | Percent who have a retirement account |
|---|---|
| Black | 34.8% |
| Hispanic | 27.5% |
| White | 61.8% |
| Other | 52.9% |
Outside of a company-sponsored 401(k), the best individual retirement accounts (IRA) offer no fees or account minimums, and are a great place to park investments and watch them grow until retirement.
Certificate of deposit ownership rate by race and ethnicity
Eight percent of white Americans own a certificate of deposit (CD), more than any other race, although they are not a popular financial tool. Just 2% of Hispanic Americans and 3% of Black Americans own CDs.
| Race/ethnicity | Certificates of deposit (CD) |
|---|---|
| Black | 3.2% |
| Hispanic | 1.8% |
| White | 7.6% |
| Other | 6.8% |
The best CDs can award higher interest rates than a savings account, but money can't always be withdrawn until the CD term ends, which can last anywhere from six months to five years. Additionally, CDs often have minimum deposit requirements.
Budgeting habits by race and ethnicity
People of color review their finances more regularly than white Americans, according to The Motley Fool Ascent survey. While 70% of white Americans review their finances at least once a month, 84% of people of color do so at the same frequency.
Hispanic and Latino Americans review their finances least regularly, although Asian Americans are most likely to not review their finances at all.
How often do you review your finances (e.g., checking your bank account and credit card balance, reviewing your spending, viewing your investment accounts)?
| Race/ethnicity | At least every month | Less than once a month | Never |
|---|---|---|---|
| Asian | 73% | 17% | 10% |
| Black | 82% | 15% | 3% |
| Hispanic/Latino | 58% | 34% | 7% |
| White | 70% | 23% | 7% |
| People of color | 84% | 14% | 3% |
| All respondents | 74% | 21% | 6% |
Budgeting apps can simplify regular financial check ups by tracking where your money is going. The best budgeting apps not only track income, spending, investments, and more, but also help set financial goals and suggest ways to save money.
Sources of financial advice and information by race and ethnicity
Friends and family, followed by websites are the most common sources of financial advice for Americans.
People of color are more likely than white Americans to lean on other sources for financial advice, such as YouTube videos, podcasts, books, and TV shows.
Where do you get most of your financial advice and information?
| Race/ethnicity | Websites | Podcasts | YouTube / videos | Books | TV shows | Friends and/or family |
|---|---|---|---|---|---|---|
| Asian | 31% | 5% | 15% | 7% | 7% | 35% |
| Black | 27% | 6% | 16% | 5% | 6% | 38% |
| Hispanic/Latino | 23% | 11% | 13% | 9% | 11% | 32% |
| White | 27% | 8% | 15% | 7% | 8% | 35% |
| People of color | 36% | 2% | 9% | 5% | 5% | 44% |
| All respondents | 29% | 7% | 13% | 7% | 8% | 37% |
Percent of Americans that know their credit score, credit card interest rate, and mortgage rate by race and ethnicity
White Americans are slightly more likely than people of color to know their credit score, credit card interest rate, and mortgage rate.
The majority of Americans know those scores, which are crucial pieces of information.
Understanding your credit score is important because credit scores are used for a range of financial decisions, from which credit cards you may be eligible for to the size and rate for a mortgage or auto loan. It's also important to know how to build credit.
Knowing your mortgage rate is crucial, because it can inform decisions about refinancing your mortgage to get a better rate, which can result in significant savings.
Do you know your credit score?
| Race/ethnicity | Yes |
|---|---|
| Asian | 70% |
| Black | 75% |
| Hispanic/Latino | 55% |
| White | 77% |
| People of color | 68% |
| All respondents | 70% |
Do you know your credit card interest rate?
| Race/ethnicity | Yes |
|---|---|
| Asian | 65% |
| Black | 65% |
| Hispanic/Latino | 66% |
| White | 71% |
| People of color | 66% |
| All respondents | 67% |
Do you know your mortgage interest rate?
| Race/ethnicity | Yes |
|---|---|
| Asian | 59% |
| Black | 56% |
| Hispanic/Latino | 56% |
| White | 61% |
| People of color | 57% |
| All respondents | 58% |
Race and personal finance in America
It's clear that good financial habits alone aren't responsible for a person's level of success. People of color are more likely to follow several recommended financial habits than white Americans, including regularly checking their finances and building an emergency fund.
Despite that, there's a significant racial wealth gap in America. People of color have a much lower median net worth, especially Black Americans and Hispanic/Latino Americans. And since wealth is largely passed down through inheritances, this wealth inequality continues from one generation to the next.
Sources
- ABC News (2006). "Study Finds Race Plays a Role in Investing."
- Federal Deposit Insurance Corporation (2020). "2017 FDIC National Survey of Unbanked and Underbanked Households."
- Federal Reserve Bank of St. Louis (2020). "The Demographics of Wealth."
- Federal Reserve Bulletin (2023). "Survey of Consumer Finances"
- McKintosh, Kristin, et. al. (2020). Brookings Institution. "Examining the Black-white wealth gap."
- Pew Research Center (2020). "Demographic trends and economic well-being."
- Tisdale, Stacey (2019). Black Enterprise. "The investing habits of wealthy Black people."
- Urban Institute (2017). "Nine Charts about Wealth Inequality in America (Updated)."
Methodology
The Motley Fool Ascent distributed the survey to 2,000 American adults via Pollfish on April 26, 2023. Responses were post-stratified to generate nationally representative results. Quotas based on race/ethnicity were used: 500 respondents identified as white, 500 respondents identified as Asian, 520 respondents identified as Latino/Hispanic, 480 respondents identified as Black.
Our Research Experts
Jack Caporal is the Research Director for The Motley Fool and The Motley Fool Ascent.
Lyle Daly is a freelance writer who has been covering personal finance since 2016.
We're firm believers in the Golden Rule, which is why editorial opinions are ours alone and have not been previously reviewed, approved, or endorsed by included advertisers. The Ascent does not cover all offers on the market. Editorial content from The Ascent is separate from The Motley Fool editorial content and is created by a different analyst team.