Published April 22, 2024
Businesses today run on data insights. But which metrics should you pay attention to? The Ascent breaks down the most important business metrics to track for your business.
Every business must track metrics. Even if you’re a photographer selling photos, you still need a roof over your head and food in your belly, right? That means the revenue metric is, at minimum, the one you must track.
Successful businesses monitor far more than revenue. They also work to improve all the key metrics that enable their company to grow.
So which metrics should you track? Why are these important? I’ve experienced a gamut of business metrics, having rolled out multi-million dollar software products and worked at both small businesses and large corporations. I know how challenging it can be to stay on top of performance metrics.
That’s why the key is to zero in on the numbers that matter most for your company. Let’s examine some fundamental data metrics to help you identify the ones to track for your situation.
Overview: What are business metrics?
An initial question may be, what’s meant by business metrics? A business metric, also referred to as a performance indicator, is a quantifiable measure of some component of your business.
It’s used to track, monitor, and assess the success or failure of these various business components. Virtually any aspect of your business can be evaluated in this way, from growth in customers to how well you retain employees.
Benefits of tracking business metrics
Mastering an understanding of business performance metrics is worthwhile because of the business intelligence tracking metrics provides. Here are specific reasons why it’s important.
1. Better decision-making
Lots of entrepreneurs and business leaders go with their gut when making decisions. But those kinds of decisions are fraught with emotion, not objective reasoning. By looking at actual business data to inform your decision-making, you avoid bias that can lead you down the wrong path.
Decision-making based on metrics puts you in a better position to choose options that promote the health and well-being of your company and its customers because you’re relying on data and facts rather than opinion.
2. Track progress
When you’re trying to get to a destination you’ve never been to, it’s helpful to have a map that charts your course and tells you where you’re at along the journey. Business metrics acts like a map for your company.
If you know you want to increase sales, the only way you confirm you’ve done it is by tracking metrics. This allows you to see the progress you’re making and to take action if improvements are necessary to meet your goals.
3. Catch problems
By incorporating metrics and reporting in your business, you can identify trends and spot a problem before it damages your company. For instance, if you notice sales are slowly declining, you can dig into why this is happening, and resolve the underlying issues before it impacts your company’s profits.
Key business metrics examples you can track
Not all metrics are created equal. Some are so foundational to the success of your business that they represent a key performance indicator (KPI). A KPI is a metric that is of particular importance, and so, you track these more closely than other metrics.
Since we have a vast array of metrics to choose from, we’ll focus here on KPIs that are important to different aspects of your business.
Financial metrics to track
The financial health of your business is tracked using these financial metrics.
1. Total revenue
This is the amount of money your company brings in as a result of business activities, such as selling goods or services to customers. If there’s no revenue to pay for the costs of running a business, there’s no company. So it’s a fundamental metric that every organization must track.
Of all the metrics, this one is the simplest to monitor. You just need a method to record the income collected from business activities. The formal means to do so is in a ledger, but a small sole proprietorship might use a simple spreadsheet.
Tip: If all revenue comes from a single product or service with a fixed price point, it’s easy to track. But once your company offers more than one item, different price points, or both, you’ve got to break down the income by these factors. Doing so allows you to analyze your pricing strategy or your portfolio of products and services to determine which are generating the most revenue for your organization.
2. Overhead
While revenue is a part of every business, so is paying expenses. Of those, overhead, also called fixed costs, is important to break out and track separately. Overhead refers to the ongoing costs of running a business that is not directly related to the creation and sale of your product or service.
Rent, legal fees, employee salaries, and utility bills are examples of typical business overhead expenses.
Tracking overhead matters because it defines how much revenue you must generate to cover these costs. It also shows what percentage of your income is going to overhead rather than the production of items that generate revenue.
If overhead is too high, you must work to reduce these costs, such as moving to less expensive office space. To track overhead, simply total up all costs related to running your business with the exception of variable costs (see below).
Tip: Tracking overhead becomes more complex as you add expenses such as employees. Therefore, it’s worth investing in accounting software like QuickBooks Online to help you track your spending on each type of overhead expense.
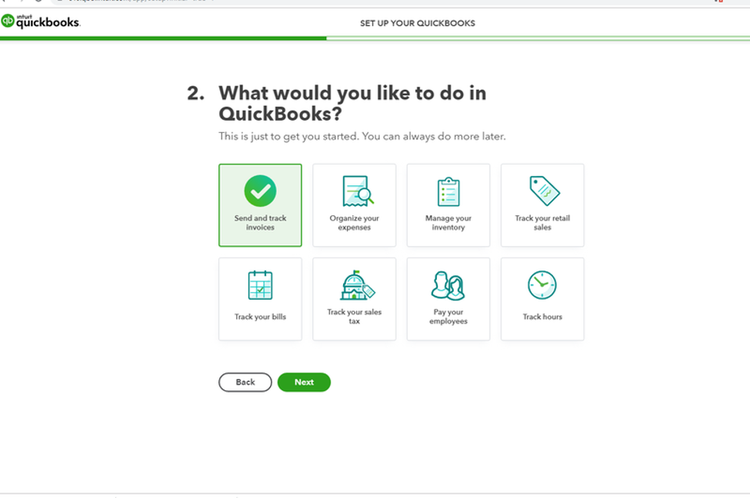
Accounting software like QuickBooks Online is essential to streamline the tracking of financial metrics Image source: Author
3. Variable costs
Overhead isn’t the only expense. Businesses have variable costs as well. Variable costs refer to all the expenses related to producing and delivering the products and services sold by your business. Examples include manufacturing expenses for the creation of a physical product, such as a toy, and sales commissions.
Variable costs depend on the amount of product you sell, so the more units sold, the higher your variable costs. Tracking variable costs allows you to manage the expense of producing your offerings and to scale up production as your business evolves.
This means you’ll want to see variable costs decline as your sales volume grows through the advantage of economies of scale and efforts you make to improve production efficiency.
Tip: Because every product produced for sale has an associated variable cost, it’s helpful to track variable costs as an average to see it at the individual item level. This provides greater visibility into how variable costs change over time. To calculate average variable cost, add up your total variable costs and divide by the total number of units produced:
- Average variable cost = Total variable costs / Total number of units produced
4. Gross margin
Taken together, overhead and variable costs comprise the components of total cost. Subtract that from revenue and you have your profit. This is a key metric to track because you want revenue to be higher than costs or you’re losing money.
An effective way to track profit is by looking at gross margin percentage. This percentage tells you how much profit you’re making from each sale. The larger the gross margin, the more profit you make.
So as your company grows or changes are introduced, you want to ensure gross margin is stable or growing. If it’s contracting, then you must dig into why to understand the causes adversely affecting margin, and thus, your profits.
You calculate gross margin by taking total revenue minus total costs and divide by total revenue. To turn it into a percentage, multiply by 100. Here is the formula:
- Gross margin percentage = ((Total revenue - Total costs) / Total revenue) x 100
For example, if your total revenue is $15,000 and total costs are $6,000, your gross margin is 60%.
Tip: You can apply gross margin in different ways throughout your business. It’s used in calculations for other metrics, such as customer lifetime value. It also helps you plan and forecast. If you want revenue to grow 10% next year, you can apply gross margin to determine how much profit you’ll have. This allows you to gauge how much you can spend on investments such as hiring staff or buying equipment.
5. Customer lifetime value
You have loyal customers regularly buying from your business. It would be great to acquire more such buyers. But at what point is the cost of acquiring customers overshadowing the revenue they generate? Customer lifetime value tells you this.
Customer lifetime value allows you to evaluate the financial worth of each customer. It gauges the amount your business can reasonably expect to earn from customers over the lifetime of their relationship with your company.
This metric is useful to apply in business decisions. It measures how long it takes a business to recoup the investment in acquiring a new customer and retaining them. It helps identify the segments of customers who are most valuable.
Moreover, the underlying metrics used to calculate customer lifetime value are important factors in your business success. Consequently, customer lifetime value encapsulates a number of key aspects of your business. These metrics are:
- Average order value: The average amount spent per customer.
- Average purchase frequency: How often customers buy from your business on average.
- Gross margin: Your profit, the same value discussed above.
- Average customer lifespan: The average amount of time between a customer’s first purchase and their last before they stop doing business with you.
The customer lifetime value metric requires first calculating the above components over a specific timeframe, usually a year, then putting the pieces together to derive customer lifetime value. Because many steps are involved, you can examine customer lifetime value in depth by reading The Ascent’s article about the topic.
Here’s a summary of the customer lifetime value formula:
- Customer lifetime value = (Average order value) x (Average purchase frequency) x (Average customer lifespan) x (Gross margin)
Tip: Customer lifetime value may seem onerous to track, but it can be transformative to your business. Amazon used it to determine that its Prime customers were the most important, and invested heavily in growing that part of its company. That’s the kind of insight you can glean from customer lifetime value, so it’s worth the effort to capture this metric.
Sales metrics to track
For companies with sales representatives, tracking certain KPIs reveals the performance of the team and provides the insights necessary to make adjustments when needed. Here are the KPIs to track for a sales team.
1. Sales target/quota
Every sales team has a sales target, or quota, to meet. This represents the number of products or a dollar amount each sales rep must achieve within a specific time period: month, quarter, or year. The quota defines the revenue generated by a company as well as a sales rep’s performance and whether they are entitled to perks like a bonus.
Therefore, it’s a fundamental sales team metric, and monitoring the progress toward hitting that number is essential.
A quota is defined in advance based on the revenue goals the company has established. To know you’re on track to reach these goals, review the percentage of sales reps meeting quota. As a general rule of thumb, at least 60% of the team should be able to meet their targets.
If that’s not happening, it could be that your quota is not realistic, or for those who are falling short, you can dig into their challenges to help them. On the flip side, if 90% or more of your sales team is hitting quota, it’s an indicator that the targets are too low.
Tip: CRM software is an essential sales analytics tool. A CRM such as Agile CRM tracks progress toward sales quota as well as providing many other business benefits, such as serving as a repository for all customer information, historical data about every customer contact, and even automating routine tasks so your sales reps can focus on selling.
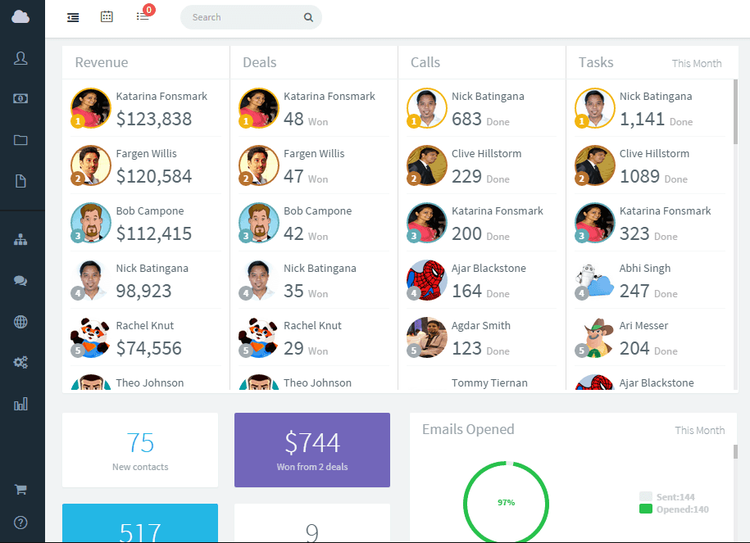
A CRM captures sales team activities and progress toward quota, surfacing that data in easily understandable reports, such as Agile’s Kanban-style reporting. Image source: Author
2. Win rate
Sales is a numbers game. If you’re going to hit your sales quota, you’ve got to know your sales win rate. The win rate, or close rate, tells you the percentage of customer prospects, referred to as opportunities, in your sales pipeline that convert into a sale.
For instance, if one out of every 10 opportunities results in a sale, your win rate is 10%. If a sales rep’s quota is 10 sales per month, they must have 100 opportunities in their pipeline to achieve their target. By tracking this metric, you know how many opportunities are required to generate enough sales to meet quota.
You also know if your sales reps are becoming more effective, when win rate goes up, or less so when it drops.
Calculating win rate is simply dividing the total number of sales by the total opportunities for the same time period used for sales quota. Multiply by 100 to turn the number into a percentage:
- Win rate percentage = (Total sales / Total opportunities) x 100
Tip: Note that win rate declines when your sales team first enters a new market. That’s because the team is getting up to speed with the nuances of selling to a new set of customers. So it’s natural to see a temporary drop in win rate but it should pick back up over time.
3. Pipeline coverage
As win rate illustrates, for a sales rep to meet their quota, they’ve got to have enough opportunities in the sales pipeline. The pipeline coverage metric lets you know if that’s the case.
Pipeline coverage measures the amount of sales pipeline you have relative to your quota. To determine how much pipeline coverage you actually have for the time period in which to meet quota, divide your total pipeline for that time period by your quota. The formula looks like this:
- Actual pipeline coverage = Total opportunities in the pipeline / Quota
So if your quota is 10 sales per month and you have 50 opportunities in your pipeline, your pipeline coverage is five times your quota.
So what should pipeline coverage be? Your sales pipeline should have enough opportunities based on your win rate to ensure you meet quota. To calculate this, you divide one by your win rate (but don’t multiply win rate by 100). The formula looks like this:
- Target pipeline coverage = 1 / win rate
By comparing your actual pipeline coverage to the target, you know the difference you need to make up to reach quota. So in the example of a 10% win rate, your calculation of 1 / 0.1 equals a target pipeline coverage of 10, which means you need 10 times your quota.
If your actual pipeline coverage is 5x, then you must increase the number of opportunities in your pipeline to achieve an actual pipeline coverage of 10x.
Tip: Before sales reps start selling, they should calculate their target pipeline coverage to assess how many opportunities to acquire. Then once they build up opportunities, they can use the actual pipeline coverage formula to ensure they’re where they need to be.
4. Average deal size
Even if sales reps have high win rates, if each sale is a small dollar amount, not only will it take many successful closed sales to achieve company revenue targets, those sales may not even be profitable. That’s where average deal size comes into play.
Average deal size tells you how much money closed sales are bringing in on average. You calculate this by dividing the total dollar amount of your sales by the total number of sales.
- Average deal size = Total dollar amount of deals / Total deals
Some sales reps will discount a company’s offerings in order to entice prospective customers to buy. You can use average deal size to spot if a rep’s number for this metric is too low to allow the company to make money.
You can also look at the average deal size across your sales team to determine ways to grow this metric as a means of increasing revenue. For example, if the average deal size was $2,000 and by introducing a new product to sell, the team could grow the average deal size to $3,000, it can justify investment in the new product.
Tip: You can quickly compare average deal size to average variable cost to ensure you’re profitable from that perspective. However, to truly ensure profitability, you have to factor in overhead costs as well. If you’ve factored in all costs and a sales rep’s average deal size is below that number, your rep is costing you money. In this way, average deal size helps you flag unprofitable situations.
Marketing metrics to track
Marketing is a key component in every business to attract and retain customers. As a result, several marketing metrics are used to track and evaluate customer success. Let’s look at the KPIs for marketing.
1. Acquisition numbers
One of marketing’s main goals is to acquire new customers, which generates leads for sales reps. Advertising campaigns drive awareness of your business. To evaluate the effectiveness of these efforts, it’s necessary to establish acquisition metrics.
Acquisition data measures the number and rate at which your marketing efforts generate new clientele. Many approaches exist to evaluate acquisition efforts, depending on the type of business and the methods used to acquire new customers.
For example, marketing in support of a sales team could measure the number of leads generated per month to ensure sales reps have a full pipeline of opportunities. Another key metric is website traffic, particularly new visitors to the site.
If your business sells a subscription product, an important acquisition metric is the number of new sign-ups.
Tip: Track acquisition numbers over time. One of the most effective ways to do so is to leverage a CRM like HubSpot. Since CRM software centralizes customer information, every new customer entry into the system can be tracked, including sources that generated those customers as well as the associated revenue.
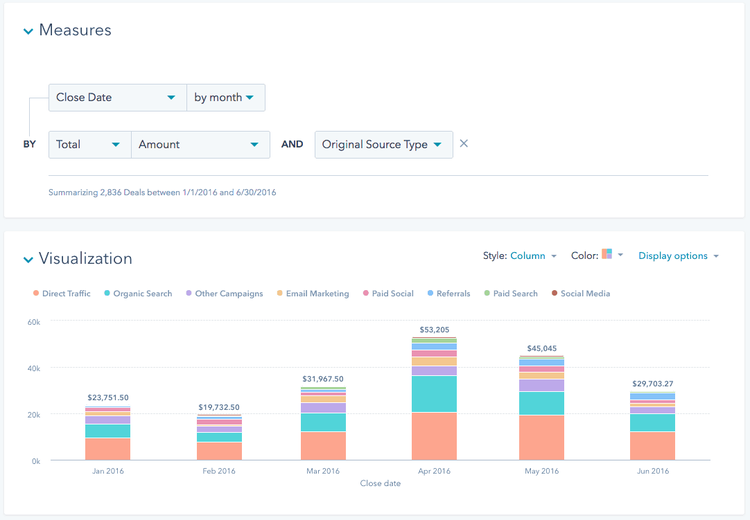
HubSpot’s CRM breaks down the effectiveness of your marketing by channel in easily customizable reports. Image source: Author
2. Retention numbers
Once you’ve worked hard to acquire new customers, you want to keep them. Your effectiveness in doing so can be tracked through retention metrics.
These metrics include a range of options depending on the types of products and services offered, the nature of your business, and what kind of retention data is important to you.
For example, you can evaluate customer loyalty by leveraging Net Promoter Score (NPS), a research technique that evaluates your customers’ likelihood to recommend your company. You can track the number of website visitors who have been to your site before.
You can use customer lifetime value to assess if any underlying metrics, such as purchase frequency or customer lifespan, are growing.
Tip: The key to tracking retention is to understand the drivers that make customers stay and what makes them leave. So regardless of which retention metrics are applicable to your business, always seek to capture what you’re doing right and where you can improve to continue keeping customers. Here again, a CRM is an ideal tool for customer analytics correlated to retention.
3. Brand sentiment
One of the main areas that a marketing team should monitor is how customers perceive the company’s brand. This customer opinion, attitude, and emotional connection toward a brand is called brand sentiment.
Brand sentiment is a measure of your reputation. If customers favorably view your business, it leads to higher retention rates and customer referrals. It also opens up customer willingness to try new offerings because clients have higher trust in the company.
Brand sentiment can also apply to specific aspects of the business to help inform how you’re doing in areas such as product quality.
To capture brand sentiment, the marketing team must review consumer comments on social media as well as direct customer feedback to the organization, and perform market research to understand customer perceptions of the brand.
This data can then be compiled to evaluate the percentage that represents positive, negative, and neutral brand sentiment around various topics, such as company pricing and customer service.
Tip: Social media software tools are available to capture and compile customer sentiment on social media. This can be helpful if your business has a large social media presence so that you don’t have to manually dig into the many social media outlets your brand appears on.
4. Return on ad spend
The money you spend on advertising to acquire and retain customers should be evaluated to ensure your company is getting a good return on its investment. This is referred to as return on ad spend (ROAS).
ROAS is a flexible metric in that you can apply it to whatever marketing initiative you’re undertaking. Whether you’re executing a social media advertising campaign or using email marketing software to run an email marketing program, you can use ROAS to determine if the investment is worthwhile.
The way to do this is to determine the total sales, or revenue, generated from the ad campaign, subtracting the advertising costs, then dividing this total by the advertising costs. Here’s the formula:
- Return on ad spend = (Total sales from advertising - Advertising costs) / Advertising costs
Because ROAS is so flexible, you can use it to determine your return all the way down to specific details of an ad campaign, like a single keyword used in search engine marketing. In this way, you can evaluate which marketing tactics lead to the most profitable outcomes for your business, then focus on those.
Tip: Depending on the type of advertising you undertake, evaluating the sales generated from it can be tricky. Digital advertising vehicles like social media offer marketing analytics methods to track your ad spend back to sales conversions whereas offline media, like radio, require a lot more work to attribute sales and calculate ROAS.
HR metrics to track
Human resource (HR) metrics are essential to understanding the effectiveness of the organization in hiring and retaining employees. This translates into overall company effectiveness because if your team is not happy or doing poorly, so is your business. Let’s examine some important workforce metrics for HR.
1. Turnover
Turnover measures the rate at which employees leave the company. Typically, turnover increases when a company is performing poorly or a big change, like a merger with another business, is in the air. In these cases, a rising turnover rate is to be expected.
It’s outside of these circumstances that the turnover metric becomes a key indicator.
Turnover is among the most important HR metrics because it signals problems in the organization. If one department’s turnover is higher than the rest, or the company’s turnover is higher than the industry norm, the HR team must dig into why. Is it due to a bad manager?
Is the work itself an issue? Is the pay low so employees frequently leave for better opportunities? These are the kinds of challenges the turnover metric can flag.
I once worked at a small company where its sales team turned over 100% each year. That meant the group had all new sales reps every year, a red flag for many reasons: an inexperienced team, higher costs due to frequent recruiting and training, and reduced productivity. That kind of turnover makes it difficult for a company to grow.
In fact, that company’s revenues were flat for consecutive years, a cautionary tale on the importance of the turnover metric.
To measure turnover rate, divide the total number of employees who leave the company in a specific time period, such as a year, by the average number of total employees. Multiply this result by 100 to get a percentage.
- Turnover rate = (Total staff who leave / Average number of total employees) x 100
Tip: Turnover isn’t just a single metric. You can segment your employee population to better understand why turnover occurs. For instance, there’s actually good turnover in the form of poor performers dismissed from the company. That’s why it can be useful to track voluntary and involuntary turnover. Also, tracking new hire turnover rates tells you if you have to improve your onboarding process.
2. Employee success rate
When employees succeed, so does the company. Tracking employee success rate allows the organization to know if the team is performing well or if challenges must be addressed.
Rather than wait for an annual performance review, the regular feedback afforded through tracking success rate allows employees to know where they’re at any time, and allows them to make adjustments needed to succeed.
Employee success rate is measured by first setting performance goals, then tracking progress on those goals. As employees accomplish each goal, the success rate increases, and it’s motivating to see it grow. In this way, an employee and manager are partnering in the employee’s achievements. Here is the formula:
- Employee success rate = Goals achieved / Total number of goals
Tip: To make effective use of this metric, break down large goals into smaller chunks that can be tracked as part of the employee’s accomplishments. That way, the employee is not overwhelmed by a lot of big goals, yet has enough objectives to see their success rate grow.
To make it easy to track performance goals, especially across many employees, use HR software such as BambooHR. HR software offers the ability to input goals, and built-in metrics reporting makes tracking progress easy. It also includes many features that help organizations with tasks like workforce planning.
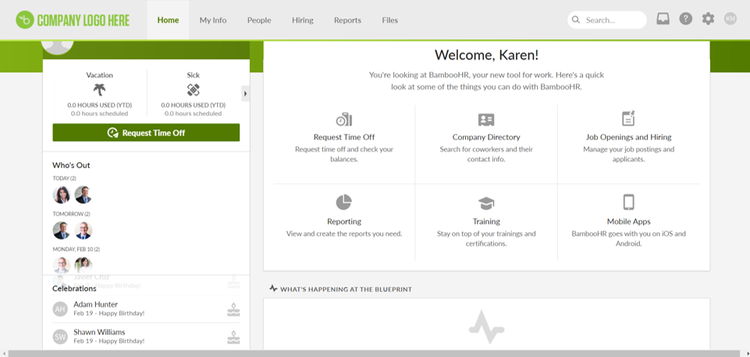
With the help of HR software such as BambooHR, employees can track performance goals as well as input time off requests and other administrative tasks. Image source: Author
3. Diversity
It’s important to have a diverse workforce. Different perspectives and points of view enrich the entire organization and help the company be innovative.
A diverse workforce also better reflects the customer base in today’s global economy, strengthening the company brand. Moreover, tracking diversity helps create a workplace environment where all employees are treated fairly and equally regardless of gender, ethnicity, or belief systems.
Building a diverse staff starts with tracking the percentage of employees who represent this diversity. You can monitor different segments of your employee population to see how diversity grows as you implement HR policies to encourage diversity growth. Here are a couple of formulas that achieve this aim:
- Percentage of women in the company = (Total women / Total employees) x 100
- Percentage of minorities in the company = (Total minorities / Total employees) x 100
Tip: It’s important to examine diversity at all levels of the organization. For example, take a look at the percentage of women in leadership roles. To do this, limit the numbers used in the above formulas to the department or organizational level you’re looking at. If there are 20 manager positions in the company and seven are women, the formula would be (7 / 20) x 100 = 35%. Then set a goal for where you want to be so you can use this metric to track progress.
4. Job satisfaction
Happy employees are motivated employees. They are more productive, deliver better service to customers, and are more likely to go above and beyond. That’s why it’s important to track job satisfaction.
This is usually done with an employee survey. The survey results are then analyzed to understand areas where the company can do better. It also enables the creation of a job satisfaction score that you want to see improve in subsequent surveys.
To calculate this score, total the number of positive survey responses and divide by the total of all survey responses.
- Job satisfaction score = (Total positive survey responses / Total of all survey responses) x 100
Tip: Use an objective third party to deploy employee surveys. This reduces the employee’s concern of reprisal for negative feedback. You want employees to be honest in their responses, and a third party that promises not to share identifiable employee data with your company ensures that.
Final advice about business metrics to track
Many more metrics exist for your company to track, such as project management metrics. The ones that matter most depend on your business. For example, if you sell products, tracking your inventory size may be important.
Just be judicious in your choice of metrics to track. You can easily become overwhelmed with data or spend too much time just collecting and analyzing rather than using the insights to actively manage the business.
With the appropriate metrics for your company in hand, you can steer your organization toward achieving your goals.
Our Small Business Expert
Robert “Izzy” Izquierdo possess over 15 years of measurable success building and marketing multi-million dollar software products. Izzy is an expert in the disciplines of Software Product Management and Product Marketing, including digital solutions for Smart TVs, streaming video, ad tech, and global web and mobile platforms.
Share This Page
We're firm believers in the Golden Rule, which is why editorial opinions are ours alone and have not been previously reviewed, approved, or endorsed by included advertisers. The Ascent does not cover all offers on the market. Editorial content from The Ascent is separate from The Motley Fool editorial content and is created by a different analyst team.
The Motley Fool has a disclosure policy.