Published April 22, 2024
Cost volume profit analysis helps business owners see their product costs in a new light. Follow these steps the next time you need to price a product or create a profit target.
There’s a lot about opening a small business that will surprise you, like how hard it is to hire and retain top talent and the fact that a dozen cups of coffee can’t replace a good night’s sleep.
You can save yourself one surprise by estimating your profit margins with a cost volume profit analysis.
Overview: What is cost volume profit analysis?
Cost volume profit (CVP) analysis reveals how many units of a product you need to sell to cover your costs or meet a profit target. It’s a type of break-even analysis that shows business owners how changes in costs and sales affect business profits.
Say you own a pajama company named Sleepy Baby LLC. You can use CVP analysis to tell you how many pajama sets you’ll have to sell to earn a $50,000 profit. I can tell you now that it’ll be a lot of pajama sets; we’ll get to a more precise answer later.
CVP analysis also helps manufacturers decide on selling prices and how many units to produce. Businesses use CVP analysis to play out “what-if” scenarios, plugging projected sales numbers into the CVP equation to see how it affects the business’s bottom line.
Businesses visualize CVP analysis through graphs and CVP income statements.
What is the cost volume profit formula?
CVP comprises a collection of formulas that shed light on the relationship among product costs, sales volume, selling prices, and profits.
Before we dive into the formulas, let’s define a few terms:
- Fixed costs: These are the costs your business incurs that don’t change based on the number of units manufactured. Expenses like rent, insurance, marketing, and depreciation count as fixed costs.
- Variable costs: These are the costs that increase in lock-step with units. For example, raw materials are a variable cost because more units require additional material.
- Unit contribution margin: Once you know your fixed and variable costs, you can get some insight into how much each additional unit “contributes” to your bottom line, or the unit contribution margin. It is yielded by the formula
Unit Selling Price - Variable Costs Per Unit = Unit Contribution Margin
- Contribution margin ratio: This is just another way of looking at your unit contribution margin as a proportion of sales price rather than in dollars. This is calculated by the formula
Unit Contribution Margin ÷ Unit Selling Price = Contribution Margin Ratio
Now we’re ready for some CVP formulas.
There are four formulas in all. The first two tell you how much revenue you need to earn or how many units you need to sell to break even -- just covering your costs and earning $0 income.
Break-Even Sales Volume ($) = Fixed Costs ($) ÷ Contribution Margin Ratio (%)
Break-Even Sales Volume (units) = Fixed Costs ($) ÷ Unit Contribution Margin
The following two add in a profit target. Use these to find the path to earning a specific profit.
Target Sales Volume ($) = (Fixed Costs [$] + Profit Target [$]) ÷ Contribution Margin Ratio (%)
Target Sales Volume (units) = (Fixed Costs [$] + Profit Target [$]) ÷ Unit Contribution Margin
How to perform a cost volume profit analysis (CVP) analysis
You’ll need no more than a firm grip of your costs and a little time to conduct a CVP analysis.
1. Sum fixed costs
Tally your company’s fixed costs:
- Rent
- Insurance
- Salaries
- Property tax
- Marketing
- Accounting
- Legal
- Equipment or depreciation
- Utilities
Not every account in your books is strictly fixed or variable. For example, your utilities have fixed and variable components: Internet and phone bills don’t change with usage, but electricity does. Split these expenses into fixed and variable categories to the extent that you can.
Of course, you can make a big to-do about bifurcating semi-variable costs using statistical regression. But if the word “statistical” makes you feel sick and you’re satisfied with a quick-and-dirty CVP analysis, you can treat all utilities as fixed expenses.
Your accounting method plays a role in what’s included in fixed costs. For example, cash method businesses don’t have non-cash expenses like depreciation and amortization. For tax purposes, you still depreciate fixed assets -- think machinery and heavy equipment -- but you might not have such an account in your accounting software. Instead, you expense the full amount of equipment purchases when you pay for them.
For accrual method businesses, depreciation and amortization count as fixed costs because they don’t change with the number of units your company sells. Since they’re non-cash expenses that don’t affect your business’s cash profits, you might choose to leave depreciation and amortization off your CVP calculation.
2. Determine the product’s selling price
CVP analysis can assess whether your target selling price gives you the profits you desire. You might return to this step many times before arriving at a selling price that works for your business.
3. Calculate the variable cost per unit
Variable costs increase for every additional unit your business produces. Add the following to find variable costs:
- Direct material (DM): Raw materials that go into your final product
- Direct labor (DL): Hourly for workers who create your final product
- Variable manufacturing overhead (VMOH): Hourly wages for manufacturing supervisors, shipping, and supplies for machinery
You’ll want the variable cost on a per-unit basis for the CVP analysis. For example, a pajama manufacturer might say it takes $5 in direct material, $5 in direct labor, and $10 in overhead to produce one set of pajamas. The variable cost per unit is $20 ($5 DM + $5 DL + $10 VMOH).
Learn more in our guides to variable costs and total manufacturing costs.
4. Calculate the unit CM and CM ratio
Subtract your variable cost per unit from the unit selling price. The difference is contribution margin, which tells you how much profit is left to cover fixed costs.
To find the CM ratio, divide CM by the unit selling price. The result should be between 0 and 1, which is the percentage of your selling price that goes toward paying fixed costs.
5. Complete the CVP analysis
You’re finally ready to complete the CVP analysis. Plug your values into each of the four CVP formulas to uncover the number of units you’ll need to sell to reach your profit goal.
Break-Even Sales Volume ($) = Fixed Costs ($) ÷ Contribution Margin Ratio (%)
Break-Even Sales Volume (units) = Fixed Costs ($) ÷ Unit Contribution Margin
Target Sales Volume ($) = (Fixed Costs [$] + Profit Target [$]) ÷ Contribution Margin Ratio (%)
Target Sales Volume (units) = (Fixed Costs [$] + Profit Target [$]) ÷ Unit Contribution Margin
A cost volume profit analysis example
Let’s address the cost volume profit analysis example I referenced earlier. The question is: How many pajama sets does Sleepy Baby LLC need to sell to earn a $50,000 profit in its first year of operations?
1. Sum fixed costs
Sleepy Baby’s fixed costs for the year are below:
| Rent | $10,000 |
| Insurance | $1,000 |
| Non-factory worker wages | $20,000 |
| Property tax | $0 |
| Marketing | $500 |
| Accounting | $500 |
| Legal | $1,000 |
| Depreciation and amortization | $0 |
| Utilities | $50 |
Fixed costs come to $33,050.
2. Determine the product’s selling price
If you’re using CVP analysis to price your product, this step is iterative. We won’t know until the end whether the selling price we choose will suffice.
Sleepy Baby conducted market research and found that customers are willing to pay up to $150 per pajama set, so let’s make $150 the selling price for the CVP model.
3. Calculate the variable cost per unit
To find each pajama set’s variable cost per unit, investigate how much direct material, direct labor, and variable manufacturing overhead is required.
- Direct material is $25 since each pajama set requires one yard of ultrasoft fabric at $25 per yard.
- Direct labor is $2 because it takes 0.2 hours for a factory worker who’s paid $10 per hour to make one pajama set ($10 per hour ✕ 0.2 hours).
- Variable manufacturing overhead is $3 per unit for shipping goods to a wholesaler.
Sleepy Baby’s variable cost per unit is $30 ($25 DM + $2 DL + $3 VMOH).
4. Calculate the unit CM and CM ratio
Subtract variable cost per unit from the unit selling price. The unit CM is $120 ($150 unit selling price - $30 variable cost per unit).
The CM ratio is 0.8 or 80% ($120 unit CM ÷ $150 unit selling price).
To translate from accounting to English, Sleepy Baby earns $120, or 80% of the selling price, per pajama set before accounting for fixed costs.
5. Complete the CVP analysis
Let’s return to the question: How many pajama sets does Sleepy Baby need to sell before earning a $50,000 profit?
(Fixed Costs [$] + Profit Target [$]) ÷ Unit Contribution Margin = Target Sales Volume (units)
($33,050 + $50,000) ÷ $120 = 692
When you plug all the known variables into the target sales volume formula, you learn that Sleepy Baby needs to sell about 692 pajama sets to reach $50,000 in profit.
Sleepy Baby can use the CVP results to decide whether it has the capacity to produce and sell 692 pajama sets.
You most commonly see CVP analyses explained through graphs like the one below. While fixed costs remain constant at $33,050, total costs increase in proportion to units. Once sales and total costs intersect at the break-even point, all you see is profit.
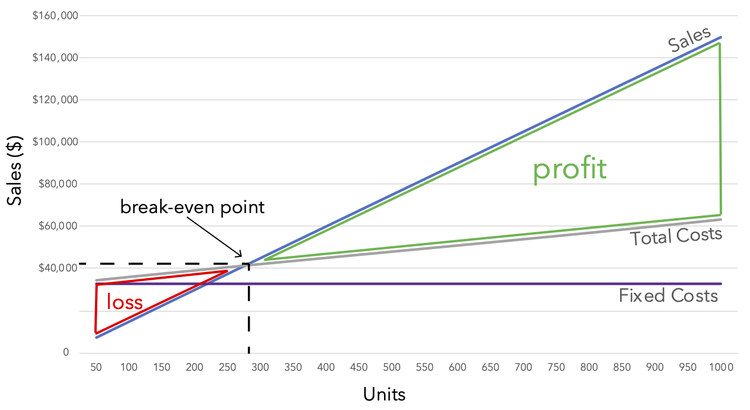
CVP analyses are most often communicated through charts. Image source: Author
2 advantages of using the cost volume profit analysis
A CVP analysis brings your business new insights without wasting too much of your time.
1. It breaks down your costs in a new way
A CVP analysis forces you to think about your product costs in a new way. Compartmentalizing expenses into fixed and variable components brings attention to the fact that not all costs increase as your business increases production.
2. It’s quick
Compiling all the information needed for a CVP analysis might take some time, but once you’re there, the calculations are quick. The same can’t be said for many accounting analysis tools.
2 disadvantages of using the cost volume profit analysis
Not all is sunny in CVP land, however. Take a look at these detractors.
1. You need to use precise costs
The CVP analysis has no value without reliable cost data.
Say you estimate that your variable costs are $50 per unit. After running a CVP analysis, you’re satisfied that a $100 selling price will yield you the profits you desire.
Later, you find out that the actual variable cost per unit is $60, significantly cutting into your profit. Your business could be on a much worse trajectory because of an inaccurate CVP analysis input.
2. It doesn’t work for job costing
Businesses that use job costing can’t take advantage of CVP analysis. Manufacturers of unique goods, like furniture and other bespoke items, can’t apply consistent selling prices and variable costs to entire product lines.
You’re a VIP of CVP
CVP analysis is just one of many tools your business can exploit to understand your business better. I recommend looking at our guide to measuring profitability for your next lesson.
Our Small Business Expert
Ryan Lasker is an accounting writer with a penchant for breaking down complex topics and has work published in USA TODAY. He is a Certified Public Accountant (CPA) licensed in the District of Columbia, holds a Master of Accountancy, and specializes in small-business financial planning.
Share This Page
We're firm believers in the Golden Rule, which is why editorial opinions are ours alone and have not been previously reviewed, approved, or endorsed by included advertisers. The Ascent does not cover all offers on the market. Editorial content from The Ascent is separate from The Motley Fool editorial content and is created by a different analyst team.
The Motley Fool has a disclosure policy.