Published April 22, 2024
To succeed in e-commerce, you need to be sure you are hitting targets and tracking the right KPIs for your online store.
Knowledge is power, and actionable insights are crucial, which is why, especially for an online store, KPIs are king. There are so many different variables you can track, however, but there are certainly some KPIs for e-commerce you will want to focus on the most.
Overview: What are e-commerce KPIs?
KPIs, or key performance indicators, are essentially data points that you track and measure success against. Think of them as checkpoints and goals, mainly, that make up various components of e-commerce success, regardless of the e-commerce platform you use to run your business.
These will be quantifiable metrics for multiple areas of performance that you can track.
What to consider when setting e-commerce KPIs
When it comes to KPIs, there are honestly hundreds of data points you can drill into, so taking a few specific considerations into account is essential. It’s important, too, to keep the idea of KPIs separate from e-commerce metrics, as metrics are just a way of measuring things.
At the same time, KPIs are a method for monitoring vital business factors, often the result of multiple metrics. For example, web traffic and the number of sales together form the KPI of conversion rate.
1. Can you make accurate measurements?
A KPI needs to have the ability to be measured accurately. There shouldn’t be overly complicated formulas; KPIs should be easily calculated.
2. Is it timely?
When it comes to e-commerce metrics, the real value is in real-time data. You don’t want outdated results influencing your current and future plans.
Old data can be useful when it is used as a comparison for new data to see patterns and trends, but you want your KPIs to be as up to date as possible.
3. Is it actionable?
We’re not just hoarding data for data’s sake. KPIs exist to help you make improvements, so they should be providing insight into areas you can improve upon.
These are action-oriented measurements that should allow you to check and adjust your e-commerce strategies, from digital marketing to product positioning and beyond.
The best e-commerce KPIs your business can track
So what should you be tracking? There are some KPIs that matter more to specifically e-commerce goals than others and can be more easily applied to sales strategies and marketing channel decisions.
1. Conversion rate
Conversion is often the first example for an e-commerce KPI for a good reason: It shows you the highest-level picture of your business's reach. Specifically, it is the percentage of visitors to your site that takes action, be it newsletter sign-up, an account creation, a sale, etc.
To calculate conversion rate, you divide the number of conversions by the number of visitors to your site and multiply by 100.
Tips for tracking conversion rate:
The average e-commerce conversion rate is around 2.5%, according to Monetate, so it’s important to follow best practices to see how your site compares.
- Look at surrounding data: After you see your conversion rate, do a deep dive into specifics. For example, if you find one of your pages has high traffic but low click-throughs to the call-to-action, you will want to edit the call-to-action to improve that rate.
- Remember that it is exponential: Conversion rate has a direc, multiplier effect on sales. So assuming you increase the conversion rate of a landing page by just 0.5%, you should see an exponential boost in sales.
2. Add to cart rate
Arguably the most essential part of a product life cycle, when an item is added to the cart, it completes an important function of the value chain. However, this does not tell you the number of completed purchases or the number of abandoned carts.
Still, it is important to know how many people are hooked long enough to consider a purchase. The add to cart rate also lays the groundwork for determining other KPIs down the road.
Tips for tracking add to cart rate:
When investigating add to cart rates, remember a few things.
- Deep dive into devices: Not all add to carts are created equal, and some industries may have people more likely to add to cart on desktop versus mobile browsing, or vice versa.
- Look into the whole customer journey: Do you have a higher add to cart rate when people reach your site through marketing call-to-actions or via organic search? Knowing your strengths can help you increase your add to cart strategy across the board.
3. Net profit
To offset your operating expenses, you need to pull in a good net profit, aka have a useful contribution margin (the amount of revenue that is greater than the total cost of expenses in producing a product).
Your net profit is calculated by subtracting your fixed expenses from your contribution margin; the amount leftover is what counts as profit.
Tips for tracking net profit:
Start your journey into profit tracking with purpose.
- Keep the basics: At the end of the day, there’s a reason for accounting basics. Have your accounting documents in line: your balance sheet, income statement, and cash flow statement.
- Control where you can: Remember, net profit is all about what is left over for you after subtracting fixed expenses. Since you generally can’t control those, you maximize net profit by increasing sales dollars.
4. Bounce rate
Simply put, bounce rate is the percentage of site visitors who leave without visiting more than one page. Higher bounce rates mean lower conversions, as the visitors have not been convinced to stay through to completing a call-to-action.
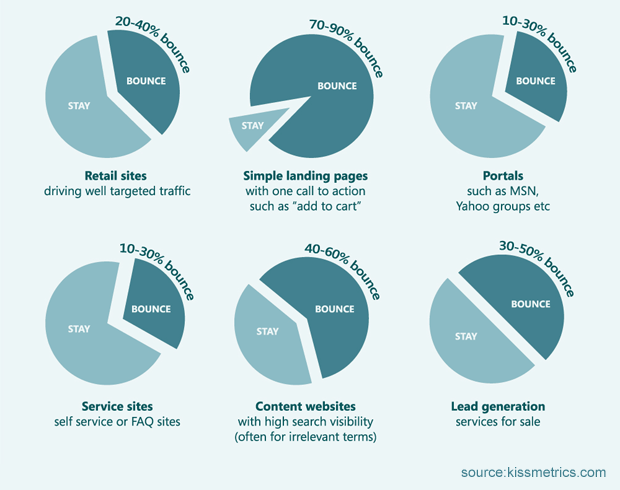
Knowing your market means a lot when it comes to bounce rate, as what is high for one industry may be low for another. Image source: Author
Tips for tracking bounce rate:
The bounce rate may seem all-encompassing, but there are some backend details to accuracy.
- Track the source: Where is your traffic coming from? You can track trends from origination from direct links, social, newsletters, etc.
- Know the industry variables: Be sure to take into account your industry to learn your standards. What constitutes a high versus low bounce rate varies widely depending on the industry.
5. Customer lifetime value
Often abbreviated as CLV, customer lifetime value refers to the average net profit predicted to be generated by each customer. In other words, what they are worth financially to your business. This can take a little more math to determine, but it is crucial.
To figure out what an individual is worth in terms of financial contributions across the length of their relationship with your business, you need to follow this formula:
Annual profit contribution per customer
Multiply by the number of years that they remain a customer
Subtract the initial cost of customer acquisition
The result is the CLV.
Tips for tracking customer lifetime value:
Math aside, you should consider these factors when determining your CLV.
- Do the legwork first: There are several metrics and KPIs that you need to know before figuring out the CLV. Make sure you know your average order value, number of times a year a customer makes a purchase, and average customer retention time.
- Measure time consistently: Decide first if you’re going to look at this in terms of months, quarters, or years, and then make sure all your variables align with that measurement.
6. Abandon cart rate
This KPI can be a bit of a downer at first glance, as an abandoned cart means a lost sale. This occurs when e-commerce visitors place items in their cart but never complete the purchase.
But it really provides some valuable insight into the purchase journey, which can be applied to customer segmentation tweaks for marketing, promotion adjustments, sales page layout changes, etc.

Insight into abandon cart KPIs can help fuel proactive ideas. Image source: Author
Oberlo
To determine your abandon cart rate, you divide your total number of completed transactions by the number of shopping carts created and multiply by 100.
Tips for tracking abandon cart rate:
There are some finer points to keep in mind when tracking this KPI to ensure you are working from correct data and have a big-picture outlook.
- Know the industry stats: An excellent way to determine where you stand in comparison (and thereby to keep yourself from getting too scared too quickly) is to know the industry statistics. Specifically, the Baymard Institute reports that the average abandon cart rate for e-commerce is almost 70%.
- Investigate reasons: To keep this actionable, you should have ways to improve your rate. By looking into causes for abandoned carts (customers just browsing, technical or 404 errors, high shipping costs, payment processing problems, etc.), you can help correct a high rate.
7. Organic search rankings
The most successful online stores rank high in organic searches. Rather than using paid ads to do most of the work, a good marketing campaign to raise brand awareness will aid in organic search ranking.
Tips for tracking organic search rankings:
Ranking well in search is a key marketing objective, so you should really dial in on tracking this KPI with purpose.
- Look at page speed: It may not be at the forefront of your mind, but loading speed can affect your search engine ranking. Faster pages mean higher rankings.
- Do your keyword research: Search engine optimization, or SEO, is an art, not a science, but knowing the playing field goes a long way. Some keywords are oversaturated, while some are under-searched, so make sure you learn the sweet spots for your industry.
8. Average order value
Just how much money are you making per order? It is important to track this, as a simple bump in average order value (which is calculated as revenue divided by the number of orders) means an instant increase in revenue across the board.
Tips for tracking average order value:
Tracking this KPI can be made more efficient by keeping a few things in mind.
- Look for culprits in trends: If you suddenly have a very sharp deviation from your typical amount, make sure you investigate the why behind it. Is it seasonal? Did your marketing pause?
- Explore cross-selling: A lot of average order amounts can be influenced by upselling and cross-selling. Consider suggesting related products and see if that contributes to a positive trend.
9. Inventory turnover
This KPI looks at how often you can sell through your in-stock inventory in a year. It’s important to know, as it links to the supply chain and correlates to your store’s ability to produce sales and higher revenue.
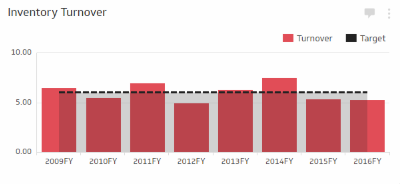
You want to have a substantial turnover to target alignment, so you are maximizing profits. Image source: Author
Klipfolio
To determine inventory turnover, you subtract the cost of your sales from your total sales and divide that by your remaining inventory.
Tips for tracking inventory turnover:
When tracking turnover in inventory, you should remember a few things.
- Push out the old: You want to focus on pushing the turnover of older stock. The longer you carry inventory, the more the cost associated with it increases while its value decreases, creating an ever-growing gap.
- Do your industry research: There’s no magic "good" stat here, as average turnover rates vary widely by industry. While high performers will always tend to turn over more inventory more quickly, do your research into what is standard for your specific business niche.
10. Customer satisfaction/net promoter score
Happy customers mean more sales. Satisfied customers are both more likely to make repeat purchases as well as recommend others to purchase from you. You can measure this in your net promoter score (NPS) to determine your amount of detractors, neutral parties, and promoters.
You will need to gather info via a satisfaction survey, with correlated numerical scores, mostly a 1–10 rating, with 0–6 being a detractor, 7–8 being a neutral party, and 9–10 being a promoter score.
Break down the number of detractors, neutrals, and promoters and divide each by the total number of responses: That is your NPS. A higher NPS is better.
Tips for tracking NPS:
When you dive into satisfaction, check a few details.
- Understand the categories: Obviously, you want as many promoters as possible. But neutrals aren’t necessarily bad, as they may just be a few touchpoints away from being a promoter. However, keep in mind they can also be swayed by a competitor, so focusing efforts around neutrals can be even more critical than focusing on detractors.
- The range is wide: According to Temkin, the average NPS ranges from 27 to 71 across businesses, though general e-commerce hosts around 60.
KPIs are the keys to your kingdom
KPIs are valuable indicators of how your business is performing and can help you make decisions about almost everything you are doing, from e-commerce marketing to technical choices for your site.
Do you need to increase your email marketing? Are people skimming and then leaving your site? By knowing where, in all the data, your strengths and weaknesses are coming from, you can adjust your business and increase your bottom line.
Our Small Business Expert
Rose Wheeler is a seasoned writer and content manager with more than 15 years of experience. She specializes in content related to digital marketing, small business, personal finance, and CMS. Her work has appeared on sites such as Selz, The Cheat Sheet, and Swaay. When she's not working with her awesome clients, Rose enjoys cooking, playing games and curling up with a good book.
Share This Page
We're firm believers in the Golden Rule, which is why editorial opinions are ours alone and have not been previously reviewed, approved, or endorsed by included advertisers. The Ascent does not cover all offers on the market. Editorial content from The Ascent is separate from The Motley Fool editorial content and is created by a different analyst team.
The Motley Fool has a disclosure policy.