Published April 22, 2024
Running financial statements is important, but understanding what those statements are telling you is even more important. Learn how to analyze your small business's financial statements.
As a business owner, you know the importance of running financial statements. But what do you do with those statements after they’ve been run?
A. After running your financial statements, you place them in a nifty binder and forget about them.
B. You analyze the numbers on the financial statements to get a better idea of how your business is performing.
C. You want to analyze the numbers, but you’re not sure how.
If you chose, B, good for you. If you chose C, we can help you get started. And if you chose A, I hope that binder is really nice.
Overview: What is a financial statement analysis?
As official as it sounds, you don’t need to be a CPA to perform financial statement analysis. When I worked as an accountant for a group of medical centers, I was responsible for accounting for three centers. A big part of my job was not just entering financial data, but understanding what the numbers on financial statements meant.
So after financial reports were prepared and shared with my boss, one of the first things we did was meet and discuss those numbers, which included knowing why our revenue dropped or an expense increased.
It wasn’t anyone’s favorite thing to do, but by the time I left that job, I knew the finances of those medical centers better than anyone.
Whether you’re doing startup accounting for your new business or your business is well established, it’s your responsibility as a business owner to know your business numbers better than anyone. That’s why financial statements analysis is so important.
Types of financial statements
Before you can begin to analyze your financial statements, let’s go over the three main financial statements. You may also want to add the Statement of Owners’ Equity to this list, though for small businesses, there’s little analysis that needs to be done.
However, if your business has multiple owners or investors, the Statement of Owners’ Equity becomes an important tool for both current and potential investors. Conveniently, all of these financial statements can be run using your current accounting software application.
1. Balance sheet
A balance sheet provides a handy snapshot of your business assets, liabilities, and owners’ equity as of a specific date. A balance sheet follows the accounting equation:
Assets = Liabilities + Shareholders’ Equity
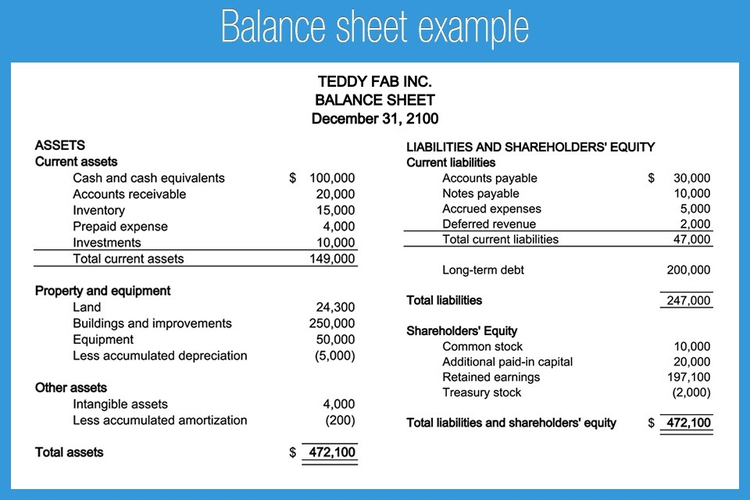
Your balance sheet lists total assets, liabilities, and shareholders’ equity. Image source: Author
A balance sheet displays the following information.
- Assets: Assets are anything that your business owns. Your bank balance, inventory, and accounts receivable balance are all considered assets.
- Liabilities: Liabilities are things that you owe. Your accounts payable balance, payroll expenses, loans, and notes payable balances are all liabilities.
- Shareholders’ Equity: Shareholders’ equity refers to the overall net worth of your business and represents the money belonging to shareholders, whether that’s just you or numerous owners or investors.
2. Income statement
Income statements report how profitable your business was during a specific period, detailing the amount of money your business spent as well as the amount of revenue your business earned.
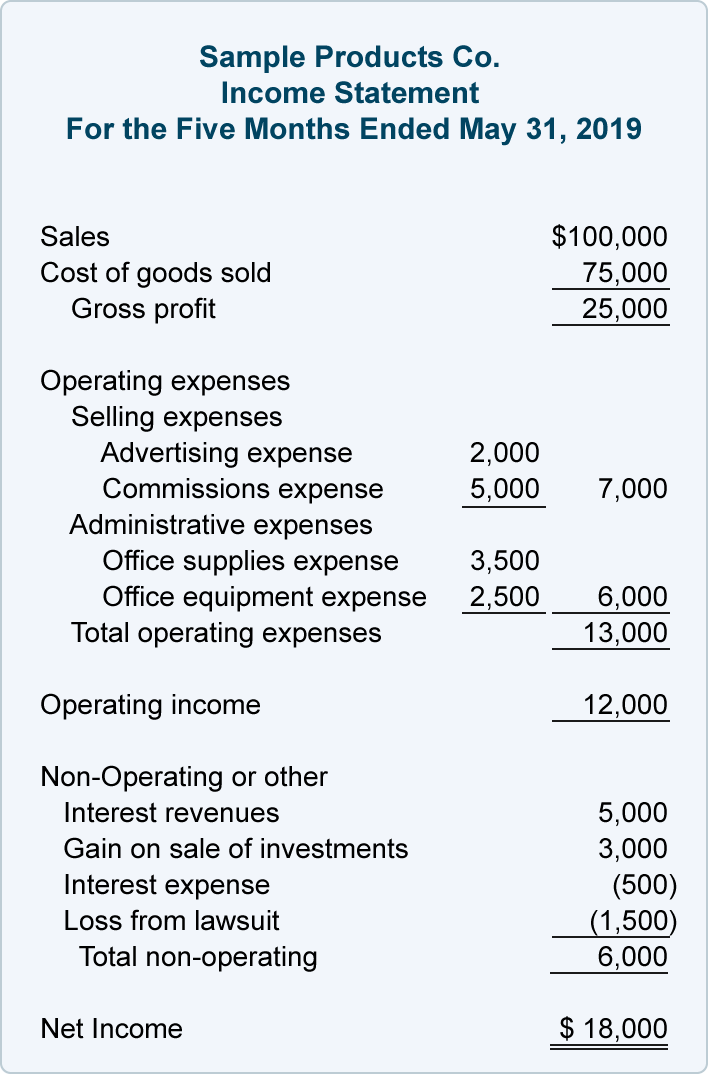
The income statement displays sales, gross profit, operating expenses, and net income totals for your business. Image source: Author
An income statement provides detail in the following categories.
- Sales: Sales is the revenue your business has earned from selling products or services.
- Cost of goods sold: COGS is an important metric because it tells you how much money you’ve spent to create the products or services you’ve sold.
- Operating expenses: Sometimes referred to as the cost of doing business, operating expenses such as rent, utilities, and maintenance costs are costs incurred regardless of the number of products or services sold.
- Gross profit: Gross profit tells you how profitable your products or services are.
- Net profit: Net profit tells you how profitable your business is overall.
3. Cash flow statement
The cash flow statement, or statement of cash flows, gives you some much-needed detail regarding the amount of cash that has flowed into and out of your business over a specific period. The statement of cash flows can be particularly useful for smaller businesses that tend to operate with limited cash on hand.
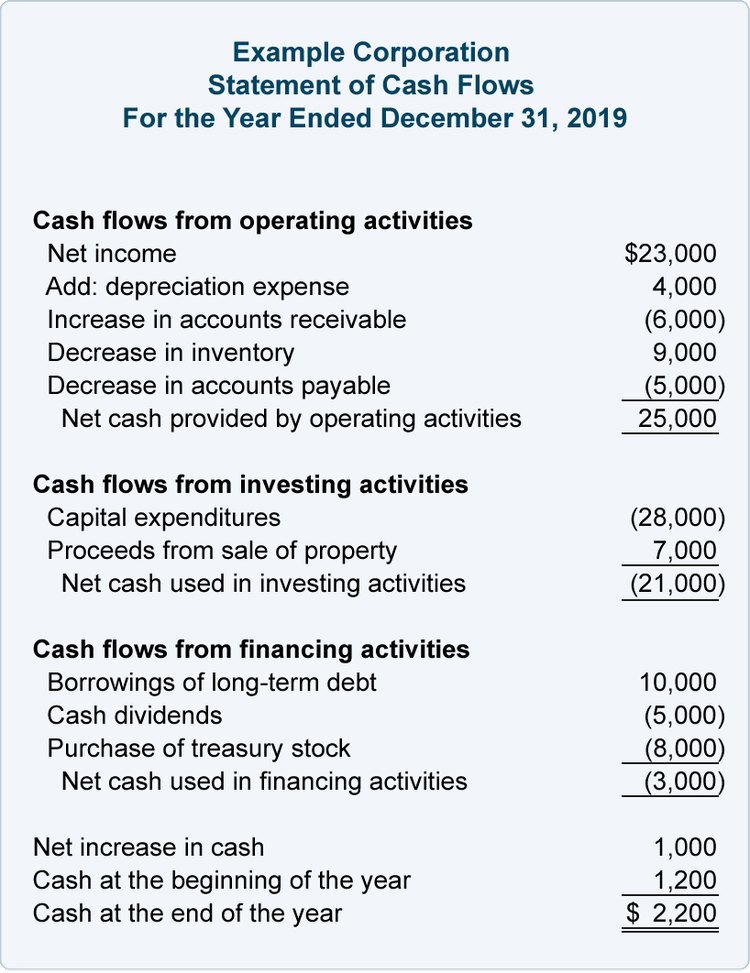
The statement of cash flows outlines cash flow in three sections, operating activities, investing activities, and financing activities. Image source: Author
Your cash flow statement is usually split into three sections:
- Operating activities: The operating activities section includes cash flow from regular business operations, including accounts receivable, inventory, accounts payable, and depreciation.
- Investing activities: The investing activities section provides detail on cash flow derived from buying or selling business assets such as a building, vehicle, or equipment.
- Financing activities: If you have either debt or equity financing that impact cash flow, it will appear in this section.
How to perform a financial statement analysis
There are two methods for financial statement analysis: vertical and horizontal analysis and ratio analysis. Vertical and horizontal analysis is used primarily with income statements, while ratios are more frequently used when analyzing balance sheet or cash flow statement activity.
1. Balance sheet analysis and ratios
There are more than a dozen financial ratios that can be performed using information contained on your balance sheet. While you certainly don’t need to perform all 15, there are 3 ratios that can be extremely useful.
Current ratio
The current ratio is a liquidity ratio performed to see how easily your business can pay off its current debt using current assets. The current ratio formula is
Current Assets ÷ Current Liabilities
For example, if your assets for the period were $45,000 and your liabilities were $31,000, your current ratio would be 1.45.
$45,000 ÷ $31,000 = 1.45
This means that for every dollar in current liabilities, your business has $1.45 in current assets. A good current ratio is between 1.5 and 3, with a higher ratio indicating you’re in a good position to cover your liabilities. In the above example, a current ratio of 1.45 would be considered slightly low, though not cause for concern unless it drops below 1.
Debt to equity ratio
The debt to equity ratio measures the amount of debt your business currently carries against shareholders’ equity. This metric is used to determine how much of your current assets are financed by outside debt or company equity. The formula for calculating the debt to equity ratio is:
Total Debt ÷ Shareholders’ Equity = Debt to Equity Ratio
For example, if your total debt is $500,000 and your shareholders’ equity is $1,000,000, your debt to equity ratio is 0.5, meaning for every dollar in equity, you have $0.50 in debt.
$500,000 ÷ $1,000,000 = 0.50
The lower the debt to equity ratio is, the more it indicates that your business is fully funded by equity rather than outside debt.
Quick ratio
The quick ratio is similar to the current ratio, but only uses cash and cash equivalents. The quick ratio formula is:
Cash + Marketable Securities + Accounts Receivable ÷ Current Liabilities = Quick Ratio
If your cash totals were $45,000, marketable securities were $10,000, and accounts receivable was $14,000, you would add those three totals and divide by your current liabilities, which are $29,000 to determine your quick ratio.
($45,000 + $10,000 + $14,000) ÷ $29,000 = 2.38
A quick ratio of 2.38 means that for every dollar in liabilities, your business has $2.38 in liquid assets.
The easiest way to understand what the numbers on your balance sheet mean is to perform these simple ratios. While you can perform other, more complex ratios, these three can provide you with the basic details you need to make informed business decisions.
2. Income statement analysis
You can choose from two methods of income statement analysis.
Vertical analysis
Vertical analysis reads an income statement vertically, viewing line item totals and their relationship with a baseline total. For example, in vertical analysis, you may look at total sales as the baseline, with all other line items a percentage of the baseline number.
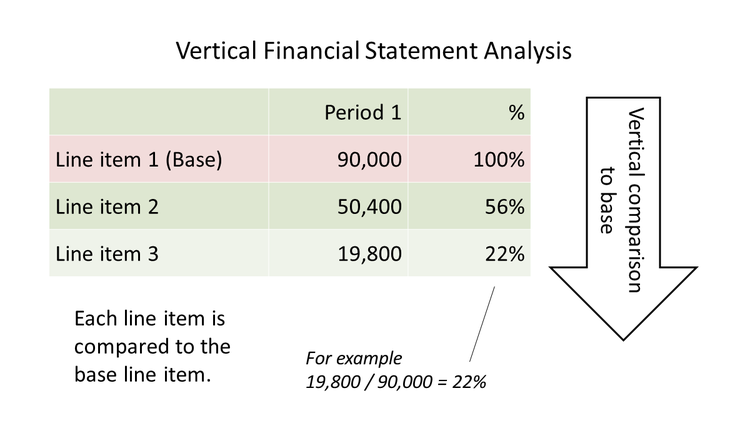
Vertical financial statement analysis uses one number as a baseline number, calculating all other line item totals as a percentage of the baseline. Image source: Author
Horizontal analysis
Horizontal analysis is a comparison of current totals to previous period totals. Horizontal analysis is extremely useful for spotting trends, as it compares income statement totals from previous periods, whether monthly, quarterly, or yearly.
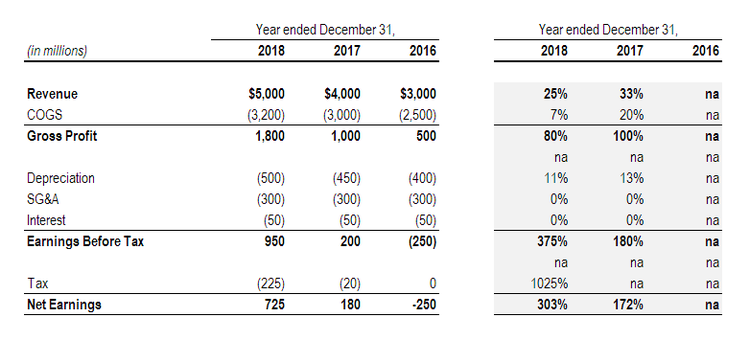
Horizontal analysis uses comparative income statements to compare income statement totals from one period to another. Image source: Author
You can also calculate financial ratios such as the gross profit ratio, operating profit ratio, and net profit ratio using numbers from your income statement.
3. Cash flow analysis
Cash flow analysis looks at three different areas: cash from operations, cash used in investing, and cash from financing. There are two ratios you can calculate that help you with analyzing your cash flow statement.
Cash flow coverage ratio
The cash flow coverage ratio looks at your company’s ability to pay off your debt with cash. The cash flow coverage ratio formula is:
Net Cash Flow ÷ Total Debt = Cash Flow Coverage Ratio
For example, if you have net cash flow of $27,000 and total debt of $15,000, the calculation would be:
$27,000 ÷ $15,000 = 1.8
The results indicate that for every dollar in debt, you have $1.80 in assets.
It’s recommended that companies have a cash flow coverage ratio of at least 1.
Cash flow margin ratio
The cash flow margin ratio is used for determining how much you’ve earned for every dollar in sales. The formula for calculating cash flow margin is:
Net Cash ÷ Net Sales = Cash Flow Margin
For example, if net cash flow is $27,000 and sales are $44,000, your cash flow margin would be:
$27,000 ÷ $44,000 = 0.61 or 61%
This means that for every dollar of sales, you made $0.61 in cash.
Don’t overthink financial statement analysis
Analyzing your financial statements is just one part of being an active, engaged business owner. While financial analysis can definitely veer into complex territory, analyzing your financial statements can sometimes be a matter of calculating a few financial ratios and running a comparative income statement. So start slow by calculating a few ratios, and as your confidence grows, take on even more in-depth analysis.
Our Small Business Expert
Mary Girsch-Bock studied accounting and business at UIC. After working as an accountant for many years in various industries, including healthcare and property management, she returned to her first love, writing. She specialized in accounting and business articles, with an emphasis on software reviews, which she wrote for more than 20 years. She continues to write for the first publication she ever wrote for, CPA Practice Advisor, while blogging for several software companies.
Share This Page
We're firm believers in the Golden Rule, which is why editorial opinions are ours alone and have not been previously reviewed, approved, or endorsed by included advertisers. The Ascent does not cover all offers on the market. Editorial content from The Ascent is separate from The Motley Fool editorial content and is created by a different analyst team.
The Motley Fool has a disclosure policy.