A Small Business Guide to POS Reports
The initial appeal of point of sale (POS) systems for most small businesses is the ability to accept credit card payments. Relegating your POS system to primarily processing customer transactions, though, is like using your smartphone only to play Sudoku when it provides a near infinite number of possibilities.
The best POS systems generate reports for multiple business areas, including sales and product performance, that contribute to inventory, customer, and employee management. We'll go over different POS reports to show how their information can inform strategic decisions at your small business.
Overview: What is a POS report?
The difference between surviving and thriving is meeting key performance indicators (KPIs). Your POS terminal captures a critical nexus of information for each transaction: sales amount, products, customer, payment method, time, location, and the employee who processed the sale.
Point of sale reports take a deep dive into this granular data to provide actionable business insights in areas including:
- Sales and marketing
- Inventory management
- Customer relationship management
- Store layout and merchandising
- Staffing decisions and policies
Careful POS analysis helps your small business identify competitive advantages and formulate strategies to capitalize on them.
5 essential POS reports for your business
You may have purchased your POS system to increase customer payment options, but the advanced reporting POS features many applications include can positively impact your overall business operations. The amount of available data can be overwhelming, however, so start with the five basic reporting areas below.
Report 1: Sales
Revenue generation drives business success, so the first reports to create on a regular basis should break out relevant sales information including:
- Sales by shift, day, and custom date ranges
- Best- and worst-selling products
- Sales by employee, department, and location
- Returned items
- Sales by device/channel, including virtual terminal and mobile payments
The ShopKeep sales analytics dashboard provides a comprehensive sales overview -- gross and net sales, returns, discounts, and more -- into which you can drill down even further.
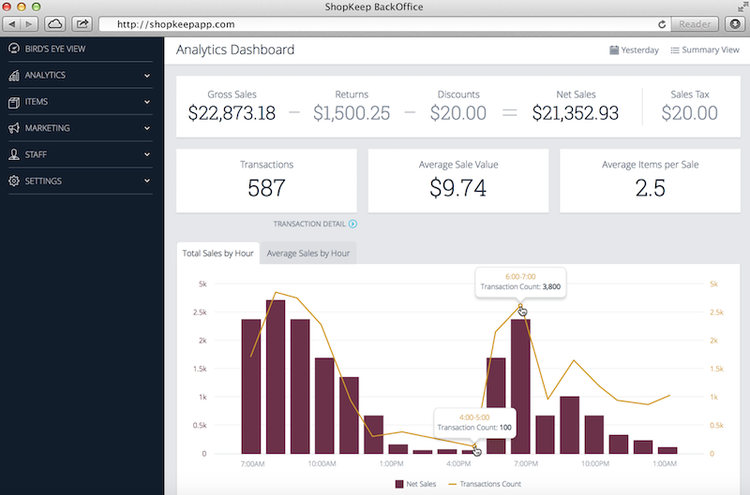
This ShopKeep multi-sale report includes the number of transactions, average sale value, and average items per transaction. Image source: Author
Sales reports that use bar, line, and pie charts to visually represent data are useful for pattern recognition. Build your sales strategies around recurring and/or cyclical customer behavior based on different triggers, such as seasonal changes that drive swapping out winter clothes for spring apparel.
Report 2: Products
POS data about product performance is an important subset of your sales information. Beyond individual item sales data, other reports to create include:
- Sales by vendor: Identify your top-selling vendor products. Increased sales may lead to better pricing discounts when reordering inventory.
- Sales by discount: See how discounts and promotions affect sales. This will help you develop your pricing strategies.
- Sales over time: Anticipate varying product demand based on annual sales patterns.
- Returns: Patterns of returned items can indicate issues with a product, sales location, or employees facilitating transactions.
This Lightspeed POS product sales report identifies best- and worst-selling products and top product categories, which tells you which product lines to build upon and which to phase out.

The Lightspeed POS product sales report includes information such as net profit per product category. Image source: Author
Combine product sales data with customer information to develop buyer personas. Use these profiles of your "ideal" customers, based on their preferences, buying patterns, and decision-making processes, to offer targeted products and create segmented marketing campaigns.
Report 3: Inventory
POS inventory reports are integral to inventory control: keeping products in stock without carrying any excess that increases your warehousing costs.
POS inventory report benefits include:
- Calculate inventory value: Keep a running total of money tied up in inventory.
- Reorder more efficiently: Identify what to order and when to reorder it.
- Avoid overselling: Avoid stockouts of your best-selling products.
- Lower warehousing costs: Only pay to store products that sell quickly.
- Increased accuracy: Access precise 24/7 inventory counts.
This ShopKeep inventory reorder report for a food-service business tracks inventory items as raw goods and creates assembled items. When a cafe sells a sandwich, for example, the amount of each ingredient -- such as bread, ham, cheese, or peanut butter -- is deducted from inventory stock.
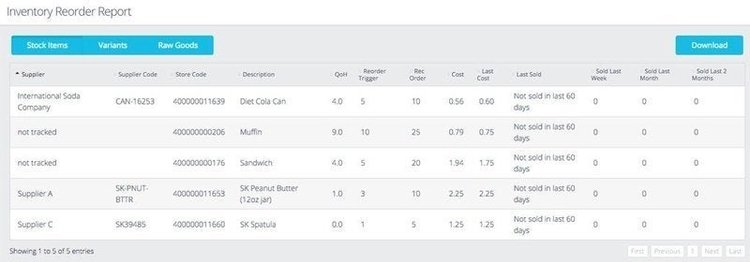
ShopKeep lets you set reorder points for inventory items. Image source: Author
Using your POS system's inventory tracking features gives you both a bird's-eye view of your overall stock and a closer look at each item.
Report 4: Customers
The greatest weakness of cash sales is that a big pile of money at the end of the day tells you nothing about the people who bought your products and services. Your POS stores important information about your customers to inform your marketing efforts:
- Sales by customer: Identify your VIP customers for extra attention to maximize revenue.
- Sales by customer group: Track underperforming customer groups to target for increased sales.
- Sales by payment method: Break out your customers' preferred payment methods to see what patterns exist to leverage.
This Shopify customer report tracks another important KPI: returning customer rate. This metric is critical because you're more likely to make a sale to an existing customer than a new one, and each sale increases customer lifetime value (CLV).

Information about new versus returning customers provides a thumbnail assessment of your efforts to cultivate recurring sales. Image source: Author
Instead of looking at each sale as a one-and-done transaction, POS customer data helps build a loyal cadre of customers. They will be your best bet for creating ongoing sales and for developing brand ambassadors.
Report 5: Employees
Employee data captured by your POS system means you no longer need a standalone time clock to track employee hours and you don’t have to pore over spreadsheets to manually calculate paychecks.
Useful employee reports include:
- Shift reports
- Hours worked
- Employee sales
- Employee commissions
The Square payroll dashboard provides an overview of payroll costs, compensation history, individual employee payment breakdowns, and tax forms. Square even lets you automatically deposit employee pay electronically or disburse physical checks.

Square's payroll cost line chart makes fluctuations over time easy to see. Image source: Author
Use this information to identify high-performing employees to schedule during peak hours, and to determine who's responsible for transaction errors -- especially as mobile point-of-sale (mPOS) devices become more common -- and needs more training.
Benefits of using POS reports to make decisions for your small business
Beyond the immediate, focused benefits of POS reports, their information also plays a role in your larger decision-making process as you examine your overarching business objectives and formulate the strategies to achieve them.
1. Business intelligence
Your POS reports contribute to business intelligence: the confluence of data mining tools, analytics, and visualizations. Business intelligence gives you insight into new markets, product demand and sustainability in different market segments, and the impact of your marketing efforts.
2. Relationship marketing
Your POS customer data drives customer relationship management (CRM) and relationship marketing, which emphasizes customer retention and satisfaction over individual sales transactions.
Customized marketing campaigns employ customer profiles with contact information and their preferred products to offer personalized discounts, special perks, and loyalty programs.
3. Inventory management
Inventory management uses your POS inventory control data to calculate product stock levels, safety stock, reorder points, and economic order quantity. Identify slow-moving products to prevent ordering and storing stock you don't need, and reorder popular items more often to avoid lost sales due to stockouts.
Use POS reports to power your business’s performance
You may have originally thought of your POS system as a glorified cash register, but you're selling it short if that's all you use it for. The breadth of information it can collect and analyze has the potential to enhance the performance of multiple areas within your business to positively impact your bottom line.
Alert: our top-rated cash back card now has 0% intro APR until 2025
This credit card is not just good – it’s so exceptional that our experts use it personally. It features a lengthy 0% intro APR period, a cash back rate of up to 5%, and all somehow for no annual fee! Click here to read our full review for free and apply in just 2 minutes.
Our Research Expert
Mark Roy Long is a technology journalist and workflow expert writing for The Ascent and The Motley Fool.
We're firm believers in the Golden Rule, which is why editorial opinions are ours alone and have not been previously reviewed, approved, or endorsed by included advertisers. The Ascent does not cover all offers on the market. Editorial content from The Ascent is separate from The Motley Fool editorial content and is created by a different analyst team.
Related Articles
View All ArticlesBy: Ben Gran | Published on Jan. 26, 2024
By: Steven Porrello | Published on Feb. 28, 2024
By: Ben Gran | Published on Feb. 27, 2024
By: Maurie Backman | Published on Feb. 27, 2024
By: Chris Neiger | Published on March 2, 2024