Published April 22, 2024
Think of a pilot flying a plane without his instruments. He's got all the buttons and controls needed to fly the plane, but has to dig around through the instrument panel every time he wants to check the speed or the altitude of the aircraft.
It's certainly an ineffective, and dangerous, way to fly an aircraft. And just like a pilot, a sales team that doesn't have a constant visual on the numbers that matter is likely to drive their revenues right into the ground.
A CRM dashboard is indispensable to the sales process, whether you’re in direct-to-consumer or B2B sales. If your team isn’t using one right now, it’s time for that to change. But if you've never set one up before, you might be a little lost on how to go about it. Fortunately, most CRMs today make it easy.
What is a sales dashboard?
A sales dashboard is the main screen on your CRM software that shows all of your critical sales data, such as leads, average deal size, revenue, conversion rate, and your sales funnel.
The best part is that it’s all updated in real time as soon as you close a sale. And that real-time updating is important, so everyone can keep a finger on the pulse of your company’s sales situation.
A good sales dashboard should provide an easily digestible snapshot of where your sales team stands for the month, making it easy to determine what the next steps should be.
How to build your sales dashboard
Setting up your sales pipeline dashboard obviously will depend on which CRM option you choose, as each has their own dashboard and customization options.
However, take these few, universal basic steps when setting whichever CRM you choose.
Step 1: Determine which metrics are most important
The dashboard is best for viewing the sales metrics that are important to you, so your first step is to determine what those metrics are. Whether you’re focused on relationship management, sales management, or account management, you’ll likely have a few metrics that are important to you and your team.
Revenue is a good one to start with; just about every sales team needs to follow that figure. Conversion rate is another one, as is revenue per sale. You should also include data on leads and something to visualize your sales funnel, so you can see how many prospects are at each stage in your sales cycle.
These are some other potential metrics to track:
- Sales target
- Opportunities
- Sales per rep
- Cannibalization rate
- Average purchase value
- Sales growth
Step 2: Set goals
Next you need to set some targets for your team to hit. After all, what good is tracking the numbers if you don’t have a specific number you’re aiming for?
If you have statistics from the last quarter on these sales metrics, take these and consult with your team to determine which areas you can do better and what a realistic target looks like. That way you’ll be on the same page as your team.
Step 3: Start with a template
Any CRM software option you choose probably comes with some sort of template that can get you started. It might auto populate the dashboard with some metrics and allow you to customize later.
Choose a template that shows a handful of the most important metrics, but doesn’t overcrowd your dashboard.
You might also choose your template based on a certain period of time, like a weekly dashboard, or perhaps a monthly or quarterly one.
Step 4: Add those metrics into your dashboard
Now is the time to customize the sales performance dashboard. Get feedback from your team as you use the dashboard to determine if you need to move metrics around.
Adjust the visual display of the metrics, maybe a pie chart makes more sense than a bar graph. And don’t be afraid to swap out metrics for others as you go along.
Perhaps you’ve determined that your team needs to keep a closer eye on revenue per sale rather than growth rate, for example, because the former has taken a huge dip in recent weeks and you want to get it back up.
Step 5: Share the dashboard with your team
Your team should all be operating off the same sales reporting dashboard, rather than having their own and just doing their own thing. This accomplishes a few things.
For one, you all are working toward the same goal and focused on hitting the same numbers. For another, if a salesperson isn’t performing in one metric compared to the rest of the team, a constant reminder from the dashboard can provide the realization that they need to change up how they’re doing things.
The best CRM software for creating an effective sales dashboard
You can set up your dashboard in many ways, but whatever way you do it, the goal should be to put the key metrics your sales team needs to track front and center.
We’ve found three different approaches to this in three CRM solutions that are worth considering.
1. Salesforce CRM
Salesforce CRM's dashboard presents your sales team’s performance headlines in a highly visual way, whether that be your B2B marketing strategies or your sales targets.
As soon as you log in you see where you stand on the big goals, like the average deal size, total value of open prospects, and how close you are to your sales goals.
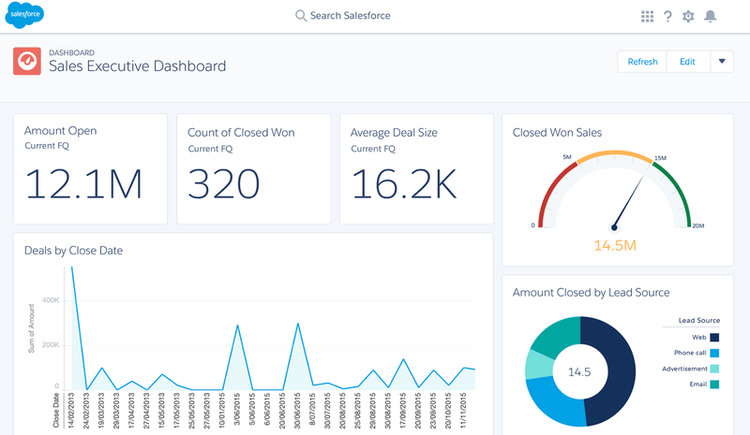
Salesforce’s dashboard is eye-catching, which is an important element of a good dashboard. Image source: Author
In the top right you have buttons that allow you to refresh the dashboard to account for any new sales data, as well as a way to edit the dashboard if you want to track different metrics or change how they are displayed.
2. Agile CRM
Agile CRM's dashboard offers a number of metrics displayed in different ways so your eyes don’t glaze over at the same format over and over again. It has a clean and highly visual style that allows you to see the big numbers right off the bat while keeping an eye on things like tasks and events.
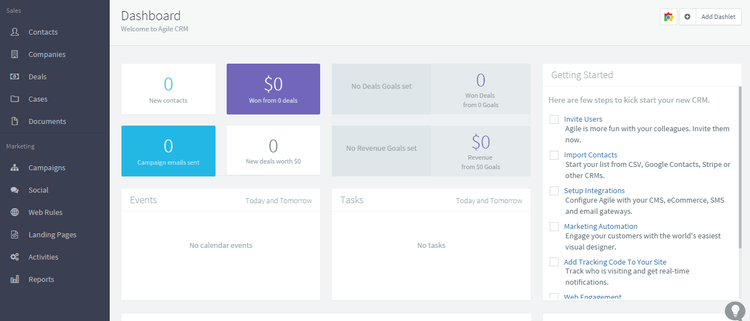
Agile CRM makes it easy to zero in on important figures. Image source: Author
At left is a handy menu, allowing your team to quickly jump to contacts, documents, campaigns, or other important functions.
3. Insightly
Insightly's dashboard keeps your eyes on the prize by presenting your one key metric, in this example, total campaign performance to date, in the featured graphic that takes up half the dashboard, while presenting four other key metrics to the right of it for additional context.
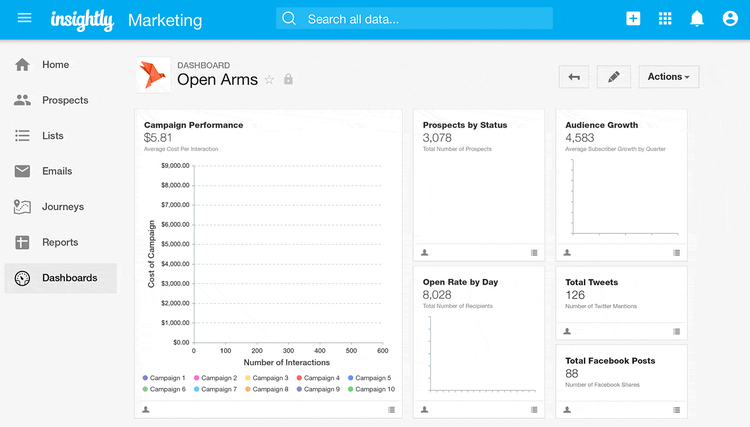
Insightly’s dashboard features key metrics plus quick links at left. Image source: Author
Insightly’s dashboard is very clean and proportional, and highly customizable. Like Agile, it has a menu at the left that links to the most important functions.
Make the dashboard a priority when you go CRM shopping
When you go looking for some CRM examples for your sales team, the temptation is to focus mostly on the price tag, features, or even third-party integrations, but the dashboard is the first thing you see when you log in. It’s what will keep your team grounded and focused on the right things.
So when you choose a few software options to try out, make sure to spend a lot of time playing with the dashboard to ensure it does what you need it to do.
Our Small Business Expert
DP Taylor has a passion for good business software and wants to help software users find the solution that best fits them. He likes to understand people's personal and business needs and figure out how software can solve problems. When he's not studying the world of business, he can be found hiking.
Share This Page
We're firm believers in the Golden Rule, which is why editorial opinions are ours alone and have not been previously reviewed, approved, or endorsed by included advertisers. The Ascent does not cover all offers on the market. Editorial content from The Ascent is separate from The Motley Fool editorial content and is created by a different analyst team.
The Motley Fool has a disclosure policy.