How to Interpret the Vertical Analysis of a Balance Sheet and Income Statement
In accounting, a vertical analysis is used to show the relative sizes of the different accounts on a financial statement.
For example, when a vertical analysis is done on an income statement, it will show the top-line sales number as 100%, and every other account will show as a percentage of the total sales number.
For the balance sheet, the total assets of the company will show as 100%, with all the other accounts on both the assets and liabilities sides showing as a percentage of the total assets number.
Case study: ABC Company's income statement
The following example shows ABC Company's income statement over a three-year period. We'll use this as the starting point to do a vertical analysis.
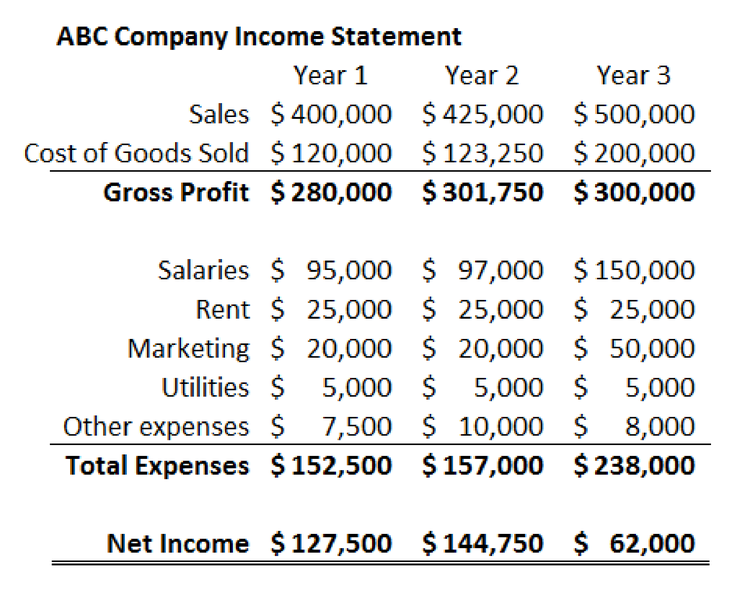
First, we should review the income statements as they're presented in dollar terms. The company's sales have grown over this time period, but net income is down sharply in year three. Salaries and marketing expenses have risen, which is logical, given the increased sales. However, these expenses don't, at first glance, appear large enough to account for the decline in net income.
To see exactly what's happening, we'll have to dig deeper.
To do that, we'll create a "common size income statement" and perform a vertical analysis. For each account on the income statement, we divide the given number by the company's sales for that year.
By doing this, we'll build a new income statement that shows each account as a percentage of the sales for that year. As an example, in year one we'll divide the company's "Salaries" expense, $95,000 by its sales for that year, $400,000. That result, 24%, will appear on the vertical analysis table beside Salaries for year one.
Here's how that table should look when completed.
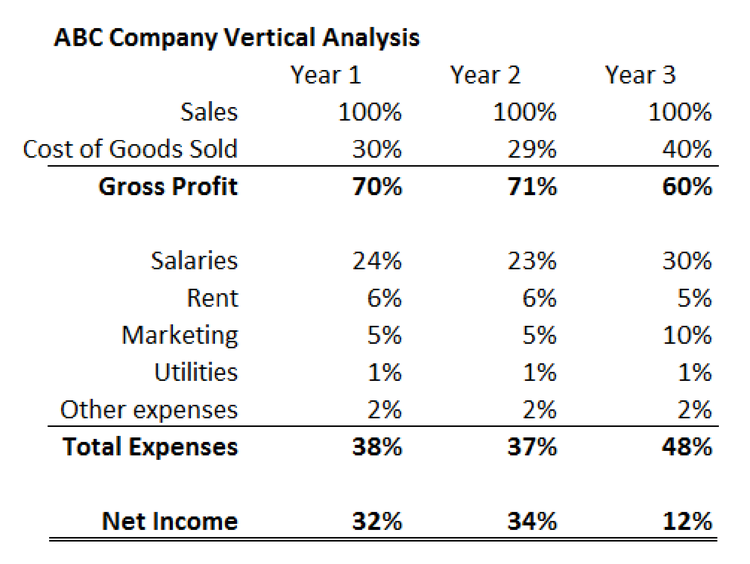
The vertical analysis confirms what we already observed in our initial review of the income statement, and it also reveals the missing driver in ABC Company's net income decline: costs of goods sold.
First, we can see that the company's marketing expenses increased not just in dollar terms, but also as a percentage of sales. This implies that the new money invested in marketing was not as effective in driving sales growth as in prior years. Salaries also grew as a percentage of sales.
The vertical analysis also shows that in years one and two, the company's product cost 30% and 29% of sales, respectively, to produce. In year three, however, cost of goods sold spikes to 40% of sales. That's driving a significant decrease in gross profits.
This change could be driven by higher expenses in the production process, or it could represent lower prices. We can't know for sure without hearing from the company's management, but with this vertical analysis we can clearly and quickly see that ABC Company's cost of goods sold and gross profits are a big issue.
Other uses and benefits of a vertical analysis
ABC Company's income statement and vertical analysis demonstrate the value of using common-sized financial statements to better understand the composition of a financial statement. It also shows how a vertical analysis can be very effective in understanding key trends over time.
The same process applied to ABC Company's balance sheet would likely reveal further insights into how the company is structured and how that structure is changing over time.
Another powerful application of a vertical analysis is to compare two or more companies of different sizes. It can be hard to compare the balance sheet of a $1 billion company with that of a $100 billion company. The common-sized accounts of vertical analysis make it possible to compare and contrast numbers of far different magnitudes in a meaningful way.
A vertical analysis is also the most effective way to compare a company's financial statement to industry averages. Using actual dollar amounts would be ineffective when analyzing an entire industry, but the common-sized percentages of the vertical analysis solve that problem and make industry comparison possible.
A useful tool in your toolbox
A vertical analysis (compared to a horizontal analysis) is excellent at showing what is happening within the financial statements of a company, but it cannot answer the most important question of any analysis: "Why?"
In ABC Company's case, we can clearly see that costs are a big reason profits are declining despite the company's robust sales growth. What we don't know, and what we can't know from the vertical analysis, is why that is happening. Did costs rise? Did management cut prices? Was it a bit of both? The vertical analysis raises these questions, but it cannot give us the answers.
Alert: our top-rated cash back card now has 0% intro APR until 2025
This credit card is not just good – it’s so exceptional that our experts use it personally. It features a lengthy 0% intro APR period, a cash back rate of up to 5%, and all somehow for no annual fee! Click here to read our full review for free and apply in just 2 minutes.
Our Research Expert
We're firm believers in the Golden Rule, which is why editorial opinions are ours alone and have not been previously reviewed, approved, or endorsed by included advertisers. The Ascent does not cover all offers on the market. Editorial content from The Ascent is separate from The Motley Fool editorial content and is created by a different analyst team.
Related Articles
View All ArticlesBy: Ben Gran | Published on Jan. 26, 2024
By: Steven Porrello | Published on Feb. 28, 2024
By: Ben Gran | Published on Feb. 27, 2024
By: Maurie Backman | Published on Feb. 27, 2024
By: Chris Neiger | Published on March 2, 2024