

Smucker sold its canned milk business in its most recently reported quarter, so it no longer owns the Carnation brand. Image source: J.M. Smucker.
Most Americans are familiar with the products that J.M. Smucker (SJM -0.70%) makes, as they include such cupboard staples as Jif peanut butter, Smucker's jam, and Folgers and Dunkin' Donuts coffee. If you'd like to familiarize yourself with Smucker's stock, these six charts should help.
Stock performance
The first thing a potential investor in Smucker stock should know is how the stock has performance relative to both the overall market and peers in the packaged food group. Included in the peer comparison group are Mondelez International (MDLZ -0.31%), Con Agra Foods (CAG 0.21%), Hormel Foods (HRL 0.23%), Kellogg, and General Mills. The first three companies are considered by Yahoo! Finance to be Smucker's closest publicly traded peers/competitors; I tacked on the latter two to obtain a larger comparison group.

Data by YCharts.
Smucker's one-year total return (which includes dividends) through Feb. 29 of more than 13% is considerably better than S&P 500's more than 6% loss. Hormel, however, is the runaway winner, with ConAgra a distant second.
Hormel primarily makes meat products, but it also produces other grocery items, such as Skippy peanut butter, the second best-selling brand of peanut butter worldwide behind Smucker's Jif. Like Smucker, ConAgra sells branded foods to consumers, but it also has commercial foods and private label segments. Its better-known brands include Healthy Choice and Peter Pan.

Data by YCharts.
While Hormel still wears the crown over the 10-year period, Smucker's 349% return considerably outpaces the others and the broader market. Past long-term performance isn't necessary indicative of future performance, though it does often reflect top management's ability to execute, in my opinion.
Revenue got a big boost from Big Heart Pet Brands acquisition

Data by YCharts.
Along with most of its peer group, Smucker's revenue growth had been trending down slightly over the last few years. That changed in March 2015 when the company bought Big Heart Pet Food Brands, a considerable player in the $21 billion U.S. pet food business that makes top brands such as Milk-Bone and Meow Mix. Smucker needed this buy, as companies can only increase earnings and free cash flow for so long if revenue is stagnant or falling.
U.S.-based producers of traditional packaged foods have been struggling to grow revenue in the last several years for two primary reasons. First, the revenue of most of these companies has been negatively affected by foreign currency exchange rates because of the strength of the U.S. dollar. Smucker has only been slightly affected by this factor because it primarily does business in the U.S. Snack-food maker Mondelez, on the other hand, has been significantly affected since the bulk of its business is international.
Second, sales volumes have been slipping in part because of changing consumer eating behavior. Consumers in the U.S. and other developed countries are increasingly choosing more healthy food options, including foods with little to no added sugar and organic foods.
Profit growth is fueled by coffee
|
Segment |
% of Total Revenue in FQ3 2016 |
Profit Margin in FQ3 2016 |
% of Total Segment Profit in FQ3 2016 |
|---|---|---|---|
|
U.S. retail coffee |
29.2% |
30.6% |
39.6% |
|
U.S. retail consumer foods |
28.9% |
22.5% |
28.8% |
|
U.S. retail pet foods |
28.9% |
17% |
21.9% |
|
International and foodservice |
13.1% |
16.8% |
9.7% |
Data source: J.M. Smucker.
Smucker's coffee segment, which sports a fat profit margin, accounted for nearly 40% of the company's total segment profit in its most recently reported quarter. Profit margin expanded 430 basis points – or 4.3 percentage points – from the year-ago period. This expansion was in part driven by the introduction of Dunkin' Brands' Dunkin' Donuts K-Cups, which Smucker began selling in grocery stores and other places where groceries are sold last May. K-Cups sport higher profit margins than traditional bagged ground coffee.
Free cash flow is powerful
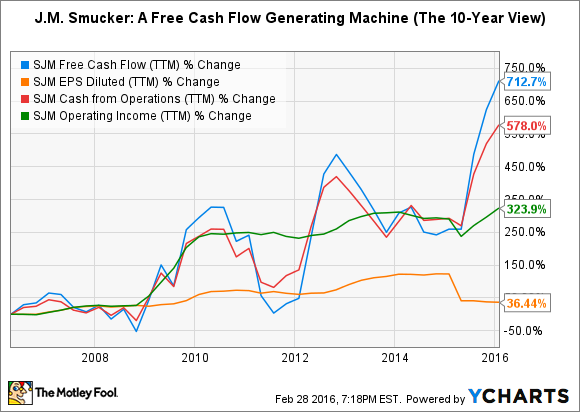
Data by YCharts.
Smucker's operating income has been trending up, though its earnings-per-share growth on a GAAP basis has been less than stellar. More experienced investors, however, know to look beyond these two commonly followed metrics to cash flows. Smucker's cash from operations and free cash flow have been growing wonderfully over both the short- and long-terms.
Cash flows provide a more accurate picture of how well a company is performing. "Earnings," or net income, and operating income are just accounting measures, while cash flows are the real McCoy when it comes to money. All sorts of legitimate things can greatly affect a company's reported earnings and operating income.
Valuation isn't as high as P/E suggests

Data by YCharts.
Smucker's valuation based upon free cash flow, P/FCF, is considerably more attractive (lower) than its valuation based upon earnings, P/E. Moreover, the stock's current P/FCF of 13.6 is lower than the seven-year median for this metric, which lends support to the bull argument for Smucker stock.


