
No one wants to own a stock that's falling, but if you invest long enough, it's inevitable -- even the best investors have had their share of stinker stocks. But just because a stock is hurting today doesn't mean it's bound to drag your portfolio down forever. It's important to distinguish between stocks that are on their way to oblivion and those that are simply waiting for the right piece of news to soar again.
Today we'll look at three of the stocks with the worst losses on the market over the past month of trading. They might have just become great investments, but the reasons for their collapse might also have made them too dangerous for your portfolio. We won't know until we dig deeper, so let's get right to it.
|
Stock |
Monthly Performance |
Market Cap |
P/E Ratio |
|---|---|---|---|
|
Bon-Ton Stores (NASDAQ: BONT) |
(34.5%) |
$225 million |
21.9 |
|
YPF S.A. (YPF 4.10%) |
(28.9%) |
$9.42 billion |
10.1 |
|
GameStop (GME 4.15%) |
(27.7%) |
$4.22 billion |
11.1 |
Source: Finviz, YCharts, and Yahoo! Finance.
Bon-Ton Stores
It's been a retail bloodbath in January -- last week's biggest monthly losers included several electronics retailers -- but Bon-Ton can't simply blame its collapse on consumers tightening their belts. The stock's biggest down day occurred after Bon-Ton reported same-store sales, which showed a major decline that was blamed on bad weather and other causes. The department store chain now has a huge guidance range for fourth-quarter earnings per share, which could fall anywhere from a $0.30 loss to a $0.15 gain. Same-store sales are now expected to be 3.5% lower for the full 2013 fiscal year compared with 2012's result, which is unacceptable no matter which way you slice it. Understandably, investors ran for the exits:
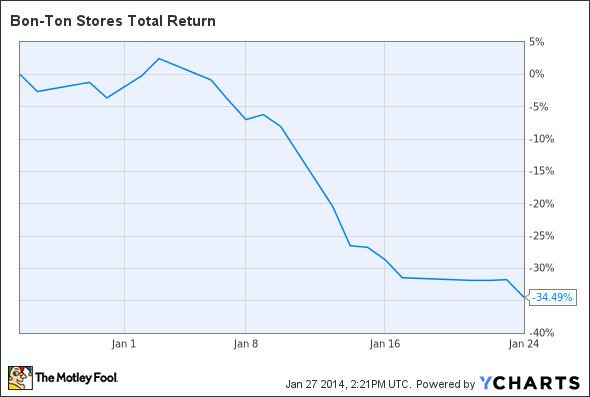
BONT Total Return Price data by YCharts.
Some investors might now consider Bon-Ton a good bargain, especially since shares have oscillated wildly over the past year and now rest at the low end of that rollercoaster range. At the same time, Bon-Ton has already returned nearly 1,000% over the past five years despite its declining revenue:
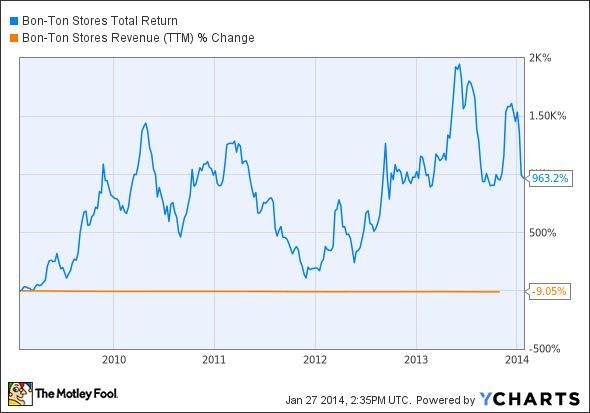
BONT Total Return Price data by YCharts.
The company has clearly pushed its results higher with greater efficiency (cost-cutting), but there's only so far that this process can go. If Bon-Ton can't actually improve its top line and profitability, it's bound to find that cost-cutting can only boost the bottom line so much. A company can blame bad weather for bad results all it likes, but consumers will still shop in the snow during the holiday season if they really want to. If they're not shopping at Bon-Ton, it's because they don't like what it is selling.
YPF
Argentine energy giant YPF was having a pretty good year until it fell apart last week. It wasn't exactly alone, as the entire group of Argentine stocks collapsed along with the country's peso. Argentina's central bank ceased its currency-intervention policy last week, which set off a stampede across emerging markets -- American investors were hit by the aftershock as major indexes fell by about 2% that same day.
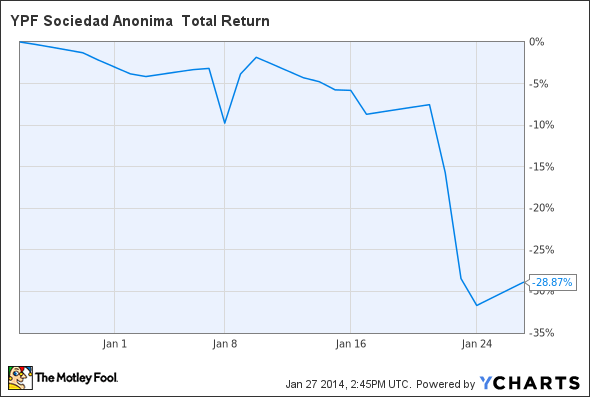
YPF Total Return Price data by YCharts.
Nothing has fundamentally changed in YPF's business, but national economic problems have a way of showing up on the income statement for natural-resource companies. Argentine inflation is quite high -- it could reach 30% this year -- and that's terrible news for a country that relies on exports to stronger economies such as China and Brazil. Inflation also ratchets up exploration costs before YPF can pull anything out of the ground, which could hinder profitability for some time.
YPF has only been independent for two years, since Argentina seized and spun it off from Spain's Repsol, but de facto support from the Argentine government could prop it up in times of trouble, unless political leaders decide that pandering to the masses with low domestic energy prices is safer than putting a floor under the price of natural gas. YPF could be a solid deep-value play, but with Argentina's economy looking quite wobbly, it could be a while before that investment really pays off.
GameStop
The electronics-retailer massacre claimed GameStop over the past couple of weeks, with the big downside move occurring after the company reported underwhelming holiday shopping results. GameStop's sales boost sales was all because of the holiday rollout of the season's two new next-generation video game consoles. Higher-margin software sales collapsed by 23% over the holidays, which longtime Fool contributor Rick Munarriz noted is due to the new consoles' lack of backward compatibility. The company's bottom line was slashed as a result, and so were share prices:
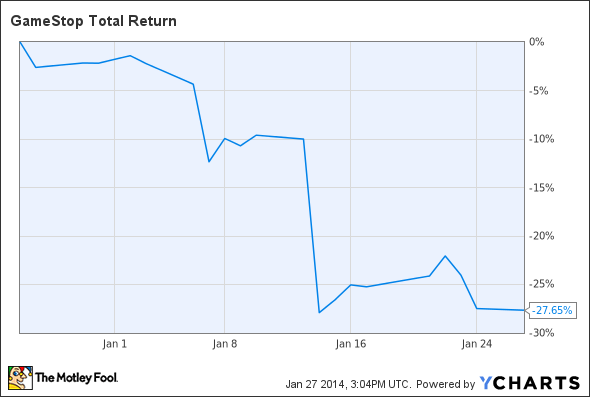
GME Total Return Price data by YCharts.
In the aftermath of GameStop's drop, Fool contributor Sam Mattera put together a detailed four-part series on "Why GameStop is Doomed" -- read part one, part two, part three, and part four by clicking the corresponding links. The general thrust of his argument is that GameStop is still playing for a brick-and-mortar win in a world rapidly shifting toward the online distribution of games. Rick Munarriz also made a salient connection between fellow big loser Best Buy's (BBY 0.60%) aggressive discount policies and GameStop's software slide. The big-box retailer has been trying all manner of customer-loyalty tricks to lure in finicky shoppers, including a gamer-friendly rewards program, but its tactics may have undermined both companies as more gamers simply move to cloud-based play.
GameStop still holds a 60% gain over the past year, but it was up by 150% before the holiday season began. At a P/E barely in double-digits, and with a dividend yield of 3%, GameStop looks like a bargain -- but if its growth will rely on low-margin consoles that are likely to be the last of their kind, then that bargain is likely to become a bad buy over the long run.


