When investors look at stocks, they usually focus on two closely interrelated things: qualitative and quantitative analysis. The former involves a non-numeric, subjective analysis of a company's characteristics, such as the quality of its management or its products or services. The latter involves a numeric analysis to monitor and assess the company's performance and can include ratio analysis.

What is it?
What is ratio analysis?
Ratio analysis involves choosing a financial ratio from a company's financial statements to monitor its progress. Examples include operating profit margins from the income statement, the debt-to-EBITDA (earnings before interest, taxation, depreciation, and amortization) ratio garnered from the balance sheet, and free cash flow (FCF) from assets using data gathered from the cash flow statement.
EBITDA
These are just three examples, but you can find and create many others to monitor a company's progress toward its strategic aims.
It's important to note that ratio analysis should be used in conjunction with quantitative analysis to provide a more complete picture. The following comparison of three ratios from two multi-industry industrials -- 3M (MMM 0.36%) and Illinois Tool Works (ITW 0.39%) -- will illustrate this point.
Comparisons
Comparing two companies using ratio analysis
Scott Santi became the CEO of Illinois Tool Works (ITW) in October 2012. He introduced a new enterprise strategy to promote an entrepreneurial culture within the company. The strategy also focused on aligning the product lines with the needs of the most important customers. Feedback was continuously gathered to customize products to customers' needs.
Let's examine the financial ratios discussed above during the decade after Santi launched the strategy and compare ITW with another multi-industry industrial, 3M. It makes sense to compare two companies in the same industry because financial ratios tend to vary significantly across industries.
Comparing a bank with a biotech company, for example, is pointless. In addition, financial ratios and their trends must be put into the context of the company's development.
ITW stock massively outperformed the S&P 500 over the decade, with a 262% increase compared to the index's 169%. Meanwhile, 3M massively underperformed, with just a 29% increase.
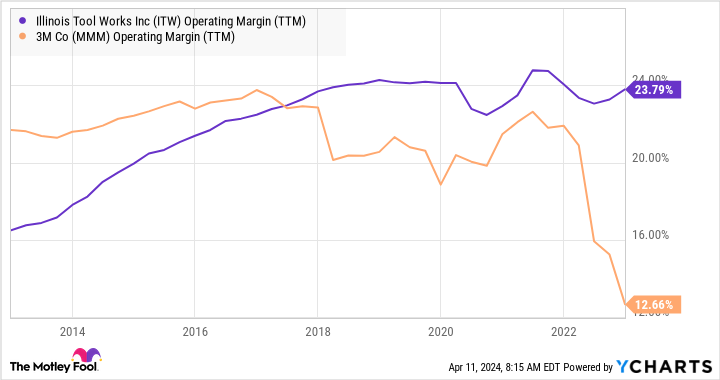
Operating profit margin
Ratio analysis: Operating profit margin
ITW aimed to increase its profit margin by fine-tuning its products and product portfolio. As shown below, ITW's strategy successfully raised profit margins.

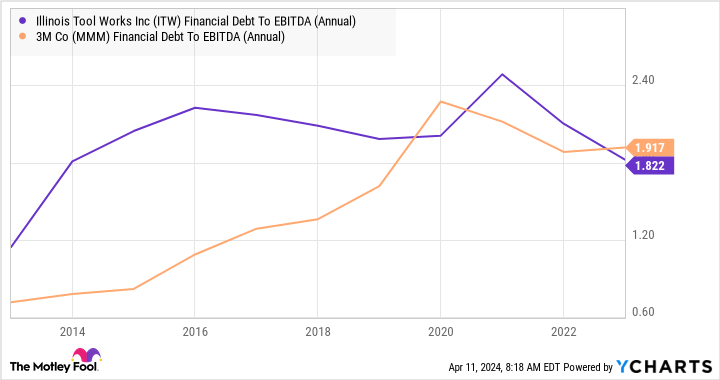
Debt to EBITDA
Ratio analysis: Debt-to-EBITDA ratio
This ratio measures debt compared to earnings (in this case, EBITDA), so a higher ratio indicates a relatively more significant debt. There's nothing wrong with debt, but it needs to be manageable. Debt-to-EBITDA ratios vary across industries, but generally speaking, a debt-to-EBITDA ratio of less than 2.5 times EBITDA is good for an industrial company.
Here, you can see that both companies increased their ratios while remaining within an acceptable range. As such, ITW is not guilty of racking up debt just to improve other ratios.

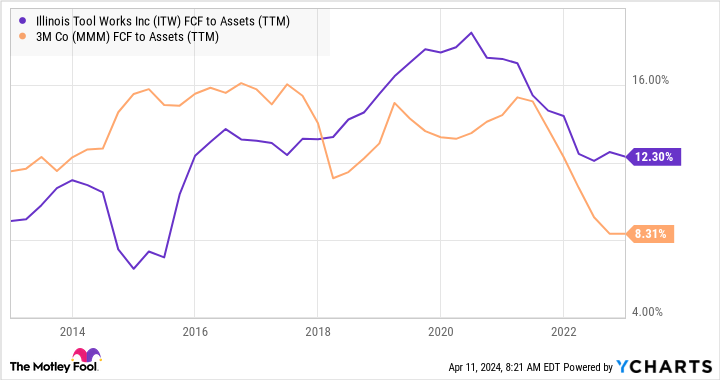
FCF to assets
Ratio analysis: Free cash flow to assets
ITW planned to utilize its assets better, generating more FCF from them. Again, management did a great job improving FCF from assets.

Using ratio analysis
Using ratio analysis
In the examples above, the ratio analysis shows clear ongoing improvement in ITW. It quantitatively confirms the qualitative improvements ITW sought to achieve with its enterprise strategy.
Related investing topics
This is a good example of how to use ratio analysis to test an investment thesis and monitor a company's strategy's progress. The ratios would help ITW gauge the success of its enterprise strategy and make adjustments along the way.


