The Relative Strength Index, or RSI, is a technical indicator that measures the speed and size of price changes in a security. The RSI can help identify when a security is overbought or oversold, which could indicate an upcoming reversal in its current price. It’s most commonly used by traders looking for entry and exit points on the securities they trade.

What is the Relative Strength Index (RSI) indicator?
What is the Relative Strength Index (RSI) indicator?
The Relative Strength Index compares how much a security goes up on good days versus how much it goes down on bad days. The typical period for determining the RSI is 14 days, but some investors may use a shorter or longer period to spot trends. The RSI is plotted on a scale from 0 to 100 over time.
Who uses RSI?
Who uses RSI?
RSI is most commonly used by technical traders as part of a broader analysis for the securities they’re interested in trading. The RSI can help provide entry and exit points on a trade as a security moves from oversold to overbought.
The RSI doesn’t have as much value for long-term, buy-and-hold investors. Those investors are much more interested in the fundamentals of a company. While many traders will also look to ensure the fundamentals of the securities they’re buying are strong, their time horizon is generally shorter. A 2017 study found a buy-and-hold strategy is better over the long term than timing the market using RSI alone.
Investors may check the RSI to help determine whether they’re getting into a stock at a good price, i.e., when the RSI indicates shares are oversold. But long-term investors are happy owning shares in great companies at a fair price, expecting the underlying company’s performance will push it to outperform.
Buy & Hold Strategy
How traders can use RSI
How traders can use RSI
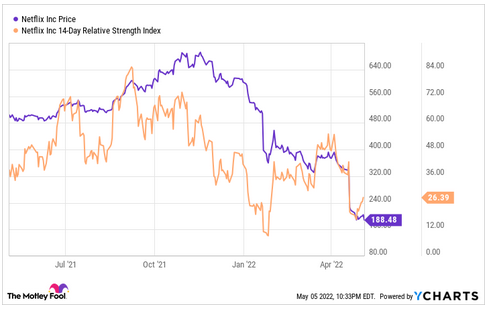
An RSI can help traders spot entry and exit points and indicate potential price trend reversals.
An RSI above 70 suggests a security may be overbought and could be a good candidate for a bearish trade. Likewise, an RSI below 30 suggests a security is oversold and could be a candidate for a bullish trade. Note, however, that the RSI can remain elevated or depressed for extended periods of time. Additionally, some securities consistently produce extreme RSI levels, which require an investor to adjust the levels they would consider to be overbought or oversold.
Traders may enter or exit a trade when the RSI crosses over their determined threshold for oversold or overbought, indicating a new trend either upward or downward.
The RSI may also help traders spot when a trend is about to reverse before it happens. Generally speaking, when the price of a security rises, the RSI will increase as well because up days are outweighing the down days. Likewise, the RSI generally decreases when the price falls.
But that doesn’t always happen. Even if the price of a security is still going up, the down days that it does have may be getting worse, while the up days aren’t as strong, sending the RSI lower. When the RSI diverges from that pattern, it’s a strong indicator that a trend will reverse.
The RSI in action
The RSI in action
If you were feeling down in the dumps in September 2022 as the stock market fell, you weren’t alone. Perhaps you thought about selling out of your entire portfolio.
But if you took a look at the RSI of the S&P 500 index at the start of October, you’d have noticed the stock market was sitting around oversold territory. If you continued to hold through mid-October, you’d have noticed a divergence in the RSI and the market. The S&P 500 hit new lows in early October, but the RSI bottomed at the end of September.
That was a strong signal to buy.
While you shouldn’t base your investment decisions entirely on RSI, it may be something to consider when considering a buy or sell decision.


