Regression models are a key tool used in statistics and investing, helping forecasters model the relationship between two variables to understand how closely they are related.
One of the values that is helpful to understand when you're using a regression model is r-squared.

What is it?
What is r-squared, exactly?
R-squared is a number between 0 and 1 that indicates how well a regression model can explain the relationship between the two variables in the model, or how well the data fits the model.
A regression model draws a line through a dot plot to give a linear representation of the relationship between the two variables.
R-squared is sometimes known as the coefficient of determination.
How do you use it?
How do you use r-squared?
Visually, a regression model consists of two key components: a dot plot showing where the two variables intersect in the data, and a regression model line that best approximates the relationship between the two variables with a linear equation.
Sometimes the line is a good fit and other times it's not. You can get a sense of this by looking at it, but the best way to know how well the model explains the relationship is with the r-squared number.
You'll want to know the r-squared value to know how well the model explains the relationship between the variables.
If r-squared is lower than you expected, you might want to investigate your original hypothesis about the relationship between the two variables. Alternatively, there may be another variable that better predicts the dependent variable you're investigating.
What do the values mean?
What do different r-squared values mean?
R-squared ranges from 0 to 1 and tells you how well the regression model fits the selected data.
An r-squared of 1 would mean that the regression model fits the data applied exactly, and perfectly explains the relationship.
An r-squared of 0 would mean that the model does not explain the relationship between the two variables at all. In other words, the relationship between the two variables is completely random, at least according to the regression model.
Alternatively, an r-squared of 0.5 would mean that the regression model explains 50% of the relationship between the two variables.
In general, an r-squared value of less than 0.3 is considered weak and a value above 0.7 is strong.
It's important to consider how well r-squared corresponds to your expectations since there are other factors to consider, such as the nature of the variables in the model and the units of measure.
How is it used in finance?
How is r-squared used in finance?
There are a lot of different applications for regression models and r-squared, and financial analysts often try to determine how different metrics influence each other.
For instance, you could run a regression analysis to see if there's a relationship between interest rates and stock prices. You might expect to find that stock prices rise when interest rates go down and fall when rates go up.
You could also run a regression to see if there's a relationship between oil prices and stock prices, or you could use a regression on an individual stock to see how macro-level data like gross domestic product, retail sales, or the unemployment rate might affect a company's stock price or a financial figure such as revenue, revenue growth, or profit margins.
To run any of those models, you're going to need to look at r-squared to see how well they perform. In finance, it's generally difficult to find causal relationships or metrics that are highly correlated, so r-squared is likely to be on the lower side.
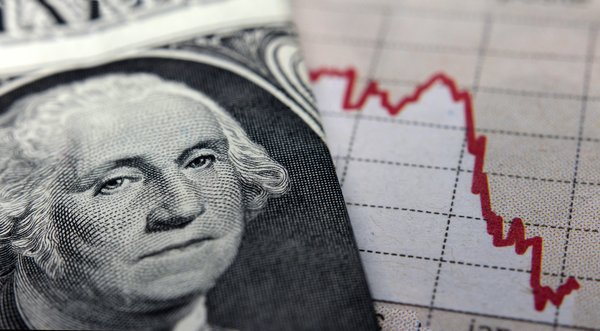
One data point that could be worth plugging into a regression is the start of a new bull market and what correlates with it.
Stocks had rebounded more than 20% from their recent lows by late 2023, but they had yet to set new highs. While it's impossible to predict when that will happen, a regression analysis and the r-squared value could show if the increase in stocks and other variables are random. There are likely to be a number of factors that have at least a small correlation with the beginning of a new bull market.