
Industrial-supply companies like MSC Industrial Direct (MSM +1.04%) are always interesting for investors because they provide an early indication of trends in industrial market conditions. However, anyone hoping for a definitive sign of a pickup from its fourth-quarter earnings would have been disappointed. The company's earnings continue to be characterized by declining end markets, but there are some slightly positive signs, not least from the initiatives management is taking to improve competitive positioning. Let's analyze the earnings and outlook in more detail.
MSC Industrial Direct Q4 earnings: The raw numbers
Starting with the headline numbers from the quarter:
- Net sales increased 2.4% compared to the same period last year, and were above the forecast range of $730 million to $742 million.
- Gross margin of 44.8% came in toward the lower end of the forecast range of 44.7% to 45.1%.
- Diluted EPS of $1.02 came in above the forecast range of $0.96 to $1.
In short, it was a pretty good quarter relative to expectations. However, don't get too excited by the sales increase, because this year's quarter contained four extra sales days than Q4 2015. In fact, average daily sales declined 3.6% in the quarter.
Moreover, management's outlook for the first quarter of 2017 is based on the assumption that average daily sales will decline 3.5% compared to the same period in 2016:
- First-quarter sales forecast to be in the range of $676 million to $688 million.
- Gross margin forecast range of 44.8% to 45.2%
- Tax rate of 38.2%
- Diluted EPS of $0.90 to $0.94
Details of the quarter
In order to monitor trends, it's useful to look at average daily sales on a monthly basis. As you can see below, conditions appear slightly better in the last three months, but the trend is far from clear. Incidentally, on the earnings call CEO Erik Gershwind disclosed that management merely took the average of September and October when forecasting November average daily sales growth, so the chart does give a good indication of how management is thinking.
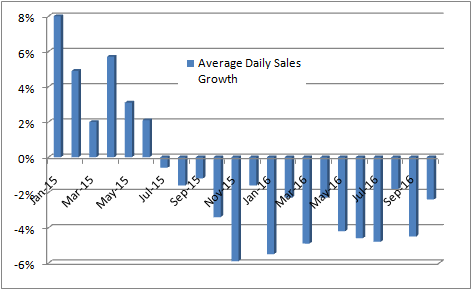
Data source: MSC Industrial Direct presentations. Chart by author.
Moreover, a look at average transaction size also suggests stagnation. This is a useful metric because as part of its expansion drive, the company has sought to increase the amount of large national accounts it services.
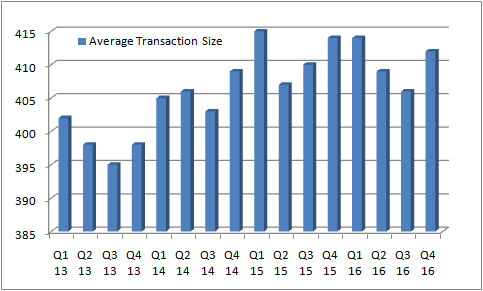
Data source: MSC Industrial Direct presentations. Figures in U.S. dollars. Chart by author.
Gross margin
Indeed, the shift to large account business (which accounted for 75% of growth in the quarter) has probably negatively impacted gross margin, as has the relatively lower growth in sales from MSC Industrial's core customers. As you can see below, the end result is a decline in gross margin in the quarter.
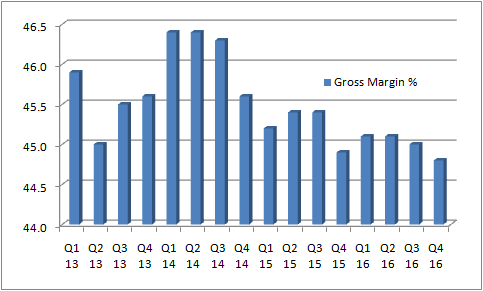
Data source: MSC Industrial Direct presentations. Chart by author.
And in case anyone was in any doubt that the slowdown is a consequence of weak industrial market conditions, the following chart breaks out growth by end market.:
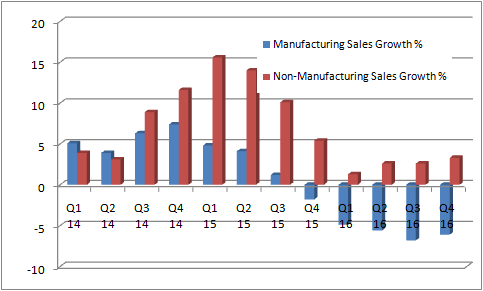
Data source: MSC Industrial Direct presentations. Chart by author.
Looking ahead
Clearly, MSC Industrial is in need of a return to growth in the industrial economy, and in particular from precisely the kind of heavy industries severely impacted by the slowdown. Management continues with its plans to consolidate the industry through chasing market share gains and servicing large accounts. When the upturn ultimately comes, the company is likely to be well positioned to reap the benefits.


