This is a story of patience and attention to detail, where small differences in the short term add up to massive divergence over decades. In the end, the biggest winners don't always deliver the fattest share-price returns. But it sure doesn't hurt to rest your portfolio on some of the richest yields available.
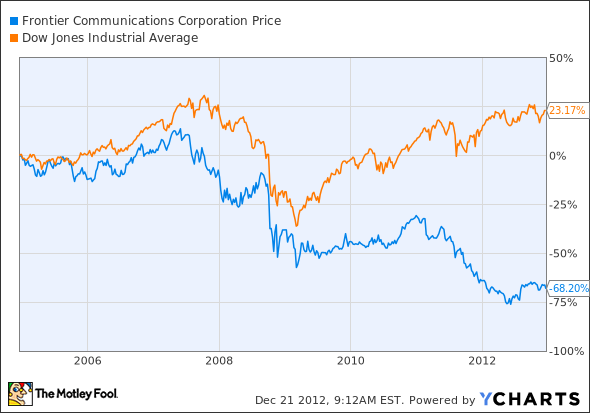
Rural telecom operator Frontier Communications (FTR +0.00%) has not kept up with the Dow Jones Industrial Average (^DJI 0.09%) over the years. Investors would have been much better off with a Dow-based index fund in the last seven years, particularly given the stock's drastic fall in 2011:
But Frontier happens to sport one of the richest dividend yields of the S&P 500, where the company is a member. How does that beefy 8.9% yield change the picture? Well, it's a mixed bag:
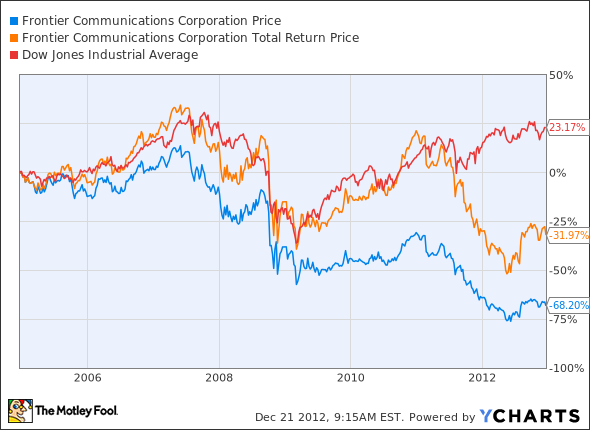
As it turns out, Frontier's dividends made up for the unimpressive price performance for years. But the slump in 2011 and lack of recovery in 2012 have put the stock far behind the broader market. And the dividend played a large role in that terrible share-price slump.
Frontier's payouts per share and dividend yields used to be a lot richer. But fellow Fool Dan Caplinger saw red lights flashing ahead in 2009, when Frontier yielded 14% but had to dig deep into cash reserves to fund it all. A year later, Frontier slashed its payouts and triggered the price drop we're talking about here. And the pain only got worse from there.
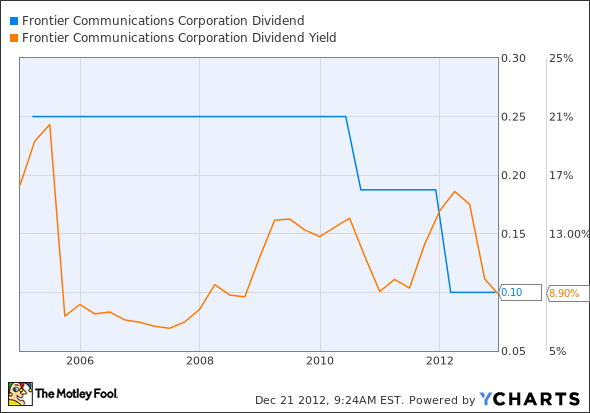
FTR Dividend data by YCharts.
Of course, opportunistic investors can make a killing by buying when everyone else is selling. Frontier could be a terrific buy right now if the ambitious expansion plan works out the way management hopes. Turning a reliable profit from the huge chunks of rural service space Frontier acquired from Verizon (VZ +2.10%) would rejuvenate Frontier's cash flows and let the company raise dividends again. The latest quarterly report was certainly encouraging:
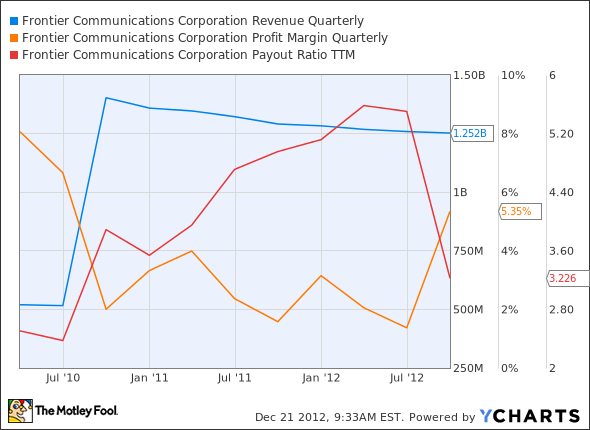
FTR Revenue Quarterly data by YCharts.
Just one more chart, and I promise we'll be done. See if you can tell the difference between a true dividend champion and the woulda-coulda-shoulda wannabes. Maximal yields don't always produce maximum profits:
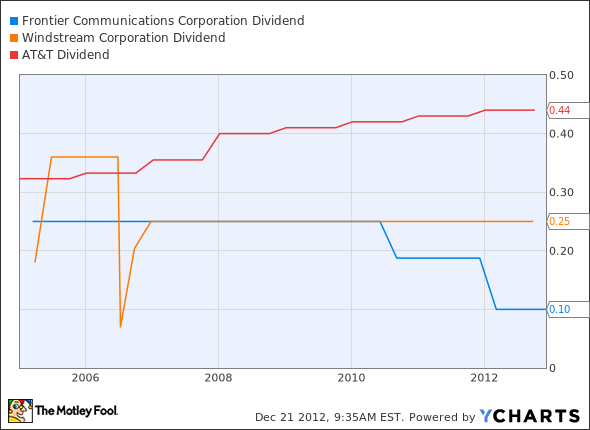
FTR Dividend data by YCharts.