Henry Kissinger famously said: "Even a paranoid can have enemies."
In the spirit of Kissinger's pragmatic paranoia, when a stock with enormous long-term potential endures a setback in the market, it's a good practice to dig into available data to test your investment assumptions. After all, even the best-run companies can be overpriced. Since Whole Foods Market (WFM +0.00%) reported fiscal 2013 first-quarter earnings in mid-February, the stock has declined about 11.5% from its recent closing high of $96.90. Despite the haircut, the company still trades at a fairly rich 32.4 times trailing-12-month earnings. Traditional grocery competitors such as Kroger (KR +4.08%) and Safeway (NYSE: SWY) sell at more mundane valuations, with recent price-to-earnings ratios of 22.4 and 10.0, respectively. If you've accumulated Whole Foods shares for the long term, you may want to ask yourself a pertinent question: Is its premium price relative to peers still justified?
Taking the pulse on gross margin and net margin
Whole Foods' stock sell-off was triggered by investor disappointment that the company did not plan to raise earnings per share or revenue growth guidance for fiscal 2013. The reluctance to raise earnings guidance is attributable to a projected static or slightly lower gross margin for the remainder of the year. Whole Foods is trying to increase its value proposition to customers by "investing in price." This means that the company is increasingly willing to adjust its pricing to attract and maintain customers, along with experimenting with product mix and promotions.
Long-term, this is a logical strategy, as the company has lately battled a reputation as a high-priced food retailer. It's also likely necessary, as the U.S. economy remains soft. Management pointed out in its earnings call on Feb. 13 that the third and fourth quarters of the prior year were record quarters for gross margin, setting up difficult comparisons for the rest of 2013 (Whole Foods' fiscal year ends on Sept. 30). That noted, the company's stellar gross margin is one of the reasons investors pay a higher multiple for Whole Foods' earnings than its competitors. Whole Foods' current 35% gross margin, for example, exceeds Kroger's current gross margin by roughly 15 percentage points.
If healthy gross margins substantiate a company's ability to price adequately and control variable costs, net profit margins are the ultimate indicator of the ability to deliver all-in earnings per share. On a quarterly basis, it's rather seductive to focus on gross margin. But long-term investors should always pause and relate gross margin and net profit margin; you want these two stars to be in alignment. Below is a comparison of Whole Foods' net profit margin with Kroger and Safeway, including a more comparable competitor, The Fresh Market (TFM +0.00%):
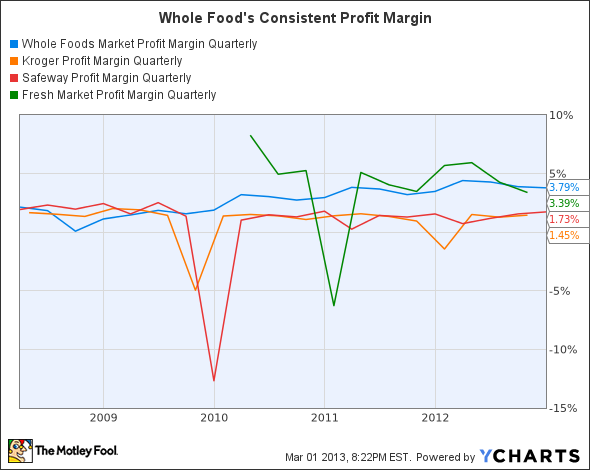
WFM Profit Margin Quarterly data by YCharts.
According to Yahoo! Finance, the average profit margin of the grocery sector is 0.7%. Part of Whole Foods' stock price premium exists in this ability to deliver net profit margins at several multiples above the industry average. In the price-sensitive grocery industry, it might appear that at a profit margin of 3.79%, Whole Foods is nearing an upper limit on its bottom-line results. But as the company enjoys greater economies of scale as it grows, there may still be room to expand net margin another percentage point or so. Finally, note how consistent net margin is when compared not only to mainline competitors, but also to Whole Foods' quite similar natural and organic foods peer The Fresh Market.
Investors are paying for management's talent at optimization
Over time, Whole Foods has become increasingly efficient at optimizing its operations. One of the long-term trends I am following with interest is the company's average store size. From the chart below you can see that up until a few years ago, Whole Foods sought to continually expand the footprint of individual stores:

Source: Whole Foods Company Earnings Release, Feb. 13, 2013.
The expansion peaked in 2007, when the average size of new stores opened was 56,500 square feet. More recently, new store size on average is on the decline, which has helped the company maintain an average aggregate size of 38,000 square feet for the last three years. According to the Food Marketing Institute, the median U.S. grocery retail store size is 46,000 feet. The last time the national average saw 38,000 feet was 1996. Why is Whole Foods so bent on controlling store size? Essentially, the company has recognized that it can obtain better results by optimizing sales per square foot, rather than just expanding average store size to sell more. The results of the last three years are worth noting:
| Metric | 2012 | 2011 | 2010 |
|---|---|---|---|
| Average weekly store sales | $682,000 | $636,000 | $588,000 |
| Average store size (square feet) | 38,000 | 38,000 | 38,000 |
| Average weekly store sales per square foot | $17.95 | $16.74 | $15.47 |
| Percentage increase | 7.23% | 8.16% | N/A |
Source: Whole Foods Market SEC 10-K Filings. N/A = not applicable.
Store size is constant, while weekly sales are rising at an appreciable rate. Earnings have also become more efficient when measured on a square foot basis:
| Metric | 2012 | 2011 | 2010 |
|---|---|---|---|
| Net income available to common shareholders | $465,573,000 | $342,612,000 | $240,355,000 |
| Total number of stores | 335 | 311 | 299 |
| Average net income per store | $1,389,770 | $1,101,646 | $803,863 |
| Average store size (square feet) | 38,000 | 38,000 | 38,000 |
| Average net income per square foot | $36.57 | $28.99 | $21.15 |
| Percentage increase | 26.15% | 37.04% | N/A |
Source: Whole Foods Market SEC 10-K Filings. N/A = not applicable.
In addition to these trends, Whole Foods has also lowered the cost of new store pre-opening expenses, from an average of $2.6 million per store in 2010 to $1.7 million per store in 2012. So on many fronts, Whole Foods' capital is being deployed with greater impact as management perfects its game. The company's return on invested capital is 13.1% as of its most recent fiscal quarter. This level of operational competence should lessen investors' worry over periodic variations in Whole Foods' robust gross margins.
The slow food movement
Whereas the typical Fortune 500 company maintains multiple business divisions, Whole Foods states: "We have one operating segment, natural and organic foods supermarkets." By keeping its focus narrow, and continually optimizing its stores, the company has the potential to return significant earnings per share to investors in the coming years. While superior margins comprise part of the company's premium valuation, the methodical, optimized growth of the company is the better reason for an investor to accept a relatively higher stock price.


