
Atlantic Power (AT +0.00%) shares are down 60% this year -- and with good reason. The company continued a downward spiral, slashing its dividend and consistently disappointing investors. But with prices at an all-time low and its first-quarter report coming out on Thursday, now could be the right time to give Atlantic Power a place in your portfolio.
I'll examine Atlantic's offerings in three parts -- first on fundamentals, then valuation, and finally the business itself. Let's take a look to see if Atlantic's fundamentals are ready to flourish.
Sales and income
Although Atlantic Power has been around for more than a decade, it first went public on New York Stock Exchange on Dec. 3, 2009, at $10.36 per share. Atlantic was still in its infancy for FY 2010 earnings, so for our purposes we'll stick to the past couple of years.
From fiscal 2011 to 2012, sales soared as the company capitalized on its growth-by-acquisition strategy. Atlantic's revenue rocketed up 369% to $440 million, but every sale has a cost. Over the same period, the utility's net income went from red to redder. Atlantic's 2012 net loss of $100 million was nearly three times worse than the year before.
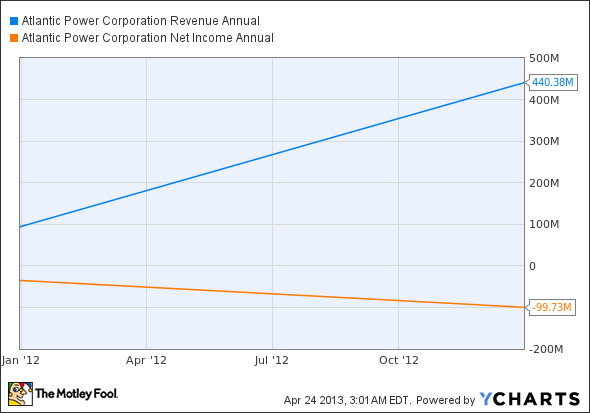
AT Revenue Annual data by YCharts.
But Atlantic wasn't alone in the world of financial flux. The past couple of years have been hard on utilities' top and bottom lines.

EXC Revenue Annual data by YCharts.
The only positive number on the above chart is Exelon's (EXC 0.09%) sales, and that only comes from its 2012 merger with Constellation Energy. FirstEnergy's (FE 0.49%) sales and net income suffered least through the Great Recession, while Ameren's (AEE 0.42%) top and bottom line felt the largest squeeze.
Margins matter
Electricity is not an iPhone. There are no new models to buy up or clever TV commercials to coax consumers into buying more. That's why margins matter immensely for utilities. Gross profit margins offer a look at the rawest profitability of a company, while operating margins give investors a sneak peek of how much utilities earn after operational costs are taken care of. Because utilities are often capital-intensive behemoths with clever year-to-year book balancing, we'll steer clear of fantasy-filled EBITDA or net profit margins.
On gross profits, Ameren takes the cake, while Atlantic is a close contender for second. TECO Energy (NYSE: TE) brings up the bottom by more than 10 percentage points, most likely because of its mining operations.

AT Gross Profit Margin TTM data by YCharts.
On operating margins, TECO struts its sector-defying stuff. Atlantic squeaks by with a 1.5% margin, while Ameren's operating costs destroy its fat gross profit margin lead.

AT Operating Margin TTM data by YCharts.
Debt addiction?
A utility may be pushing ahead on acquisitions and growth opportunities, but balanced books are an absolute necessity to ensure sustainable success. It's in utilities' nature to carry heavy debt, but too much can turn into a financial suck (not to mention result in an investor downgrade). As a rough take on each company's debt, here's how their debt-to-equity ratios chalk up.

AT Debt to Equity Ratio data by YCharts.
As of 2013, Atlantic carries a debt-to-equity ratio 70% higher than TECO, its closest competitor. Ameren and Exelon both carry nearly equal debt and equity, while FirstEnergy's debt is just 30% of its equity.
Check back for more
Atlantic reports earnings this Thursday, and the news could make or break this dividend stock. Be sure to check back for more details in the coming days as I cover the company's valuation and business model, and you'll be well prepared to evaluate Atlantic's earnings for your dividend portfolio.


